Zitellini, N., Malinverno, A., Estes, E.R., and the Expedition 402 Scientists
Proceedings of the International Ocean Discovery Program Volume 402
publications.iodp.org
http://doi.org/10.14379/iodp.proc.402.108.2025
Site U16171
![]() A. Malinverno,
A. Malinverno,
![]() N. Zitellini,
N. Zitellini,
![]() E.R. Estes,
E.R. Estes,
![]() N. Abe,
N. Abe,
![]() N. Akizawa,
N. Akizawa,
![]() M. Bickert,
M. Bickert,
![]() E.H. Cunningham,
E.H. Cunningham,
![]() A. Di Stefano,
A. Di Stefano,
![]() I.Y. Filina,
I.Y. Filina,
![]() Q. Fu,
Q. Fu,
![]() S. Gontharet,
S. Gontharet,
![]() L.E. Kearns,
L.E. Kearns,
![]() R.K. Koorapati,
R.K. Koorapati,
![]() C. Lei,
C. Lei,
![]() M.F. Loreto,
M.F. Loreto,
![]() L. Magri,
L. Magri,
![]() W. Menapace,
W. Menapace,
![]() T. Morishita,
T. Morishita,
![]() A. Pandey,
A. Pandey,
![]() V.L. Pavlovics,
V.L. Pavlovics,
![]() P.A. Pezard,
P.A. Pezard,
![]() E.M. Poulaki,
E.M. Poulaki,
![]() M.A. Rodriguez-Pilco,
M.A. Rodriguez-Pilco,
![]() A. Sanfilippo,
A. Sanfilippo,
![]() B.D. Shuck,
B.D. Shuck,
![]() P. Vannucchi, and
P. Vannucchi, and
![]() X. Zhao2
X. Zhao2
1 Malinverno, A., Zitellini, N., Estes, E.R., Abe, N., Akizawa, N., Bickert, M., Cunningham, E.H., Di Stefano, A., Filina, I.Y., Fu, Q., Gontharet, S., Kearns, L.E., Koorapati, R.K., Lei, C., Loreto, M.F., Magri, L., Menapace, W., Morishita, T., Pandey, A., Pavlovics, V.L., Pezard, P.A., Poulaki, E.M., Rodriguez-Pilco, M.A., Sanfilippo, A., Shuck, B.D., Vannucchi, P., and Zhao, X., 2025. Site U1617. In Zitellini, N., Malinverno, A., Estes, E.R., and the Expedition 402 Scientists, Tyrrhenian Continent–Ocean Transition. Proceedings of the International Ocean Discovery Program, 402: College Station, TX (International Ocean Discovery Program). http://doi.org/10.14379/iodp.proc.402.108.2025
2 Expedition 402 Scientists' affiliations.
1. Background and objectives
Site U1617 is located on the Campania Terrace about 110 km southwest of the Italian peninsula (Figure F1). Like its counterpart, the Cornaglia Terrace east of Sardinia, this part of the Tyrrhenian seafloor is the lowest portion of the continental slope at a water depth of 2600–3000 m. The generally smooth seafloor of the Campania Terrace around Site U1617 is interrupted by the Flavio Gioia and Issel Seamounts. Dredge samples from their slopes include a variety of continental basement rocks, including phyllites, quartzites, schists, gneisses, granites, and shallow-water carbonates (Colantoni et al., 1981). Approximately 50 km southwest of Site U1617, Deep Sea Drilling Project (DSDP) Site 373 (Figure F1) cored mid-ocean-ridge basalts on the flank of a basement high in the southeastern corner of the Magnaghi-Vavilov Basin (Shipboard Scientific Party, 1978).

Figure F1. Site U1617, Expedition 402 alternate drilling locations, and Site 373.
The Tyrrhenian continental margin offshore Sardinia has been drilled several times, at DSDP Site 132 (The Shipboard Scientific Party, 1973b) and Ocean Drilling Program (ODP) Sites 653 and 654 (Shipboard Scientific Party, 1987a, 1987b). In contrast, the sediments of the Tyrrhenian margin of Italy has not been directly sampled by drilling. In the Campania Terrace, seismic reflection data show a weakly reflective sediment cover, inferred to be hemipelagic Pliocene–Pleistocene sediments, followed below by a sequence of three or more reverberant reflectors interpreted as Messinian evaporites (Fabbri and Curzi, 1979). This characteristic seismic sequence can be seen on the Mediterràneo Occidental (MEDOC) Seismic Profile 6 around the location of Site U1617 (Figure F2).

Figure F2. Site U1617 location and estimated penetration.
Given the outcrops of continental basement rocks in the Flavio Gioia and Issel Seamounts and the general smoothness of the magnetic anomaly field (Caratori Tontini et al., 2004), the Campania Terrace has been generally interpreted as an area of extended continental crust. The inferred presence of Messinian evaporites suggests that rifting would have occurred earlier, in the Late Miocene; the Campania Terrace margin would then have split from its conjugate Cornaglia Terrace to the west, and further extension from the Pliocene onward would have led to the formation of oceanic magmatic crust and mantle exhumation in the Vavilov-Magnaghi Basin (e.g., figure 11 of Sartori et al., 2004).
An alternative interpretation was proposed by Prada et al. (2014), who suggested that the crust of the Cornaglia and Campania Terraces was oceanic, based on the velocity structure determined from the MEDOC seismic experiment. Prada et al. (2015) later noted that the velocity structure of the Campania Terrace crust is also quite similar to that of thinned continental crust. However, the authors still preferred the oceanic crust hypothesis because the offsets on the normal faults observed in the seismic reflection profiles across the Campania Terrace seemed insufficient to account for the extensional deformation required to thin the original continental crust. Commonly accepted models of the development of continent–ocean transitions (COTs) start with the extension of continental crust, followed by a possible phase of mantle exhumation and ending with the formation of magmatic oceanic crust (e.g., Pérez-Gussinyé et al., 2006; Davis and Lavier, 2017). In contrast, Prada et al. (2014) noted that if magmatic oceanic crust formed in the Cornaglia and Campania Terraces before the proposed mantle exhumation in the Vavilov Basin, the existing models of COT development would have to be reversed.
A major goal for Expedition 402 was to obtain new evidence from the young Tyrrhenian Sea rift to improve our general understanding of COT development. To this end, Site U1617 was located in the central part of the Campania Terrace at about 2800 m water depth (Figures F1, F2). The primary scientific objectives of Site U1617 were to recover a sequence of hemipelagic Pliocene–Pleistocene sediments and of possible Messinian evaporites to establish the age of the sediment/basement interface using tephra chronology, biostratigraphy, and magnetostratigraphy and to determine whether the basement is rifted continental material or basalt formed by magmatic accretion. A secondary objective was to sample the Messinian deposits imaged in the seismic reflection records and determine if they were composed of evaporites. Messinian evaporites were deposited in the deepest parts of the Mediterranean, so the presence of evaporites in the Campania Terrace would suggest that the area was a deep depocenter during the Messinian and that it was likely contiguous with the area of widespread evaporite deposition west of Sardinia that includes the Cornaglia Terrace.
The initial plan for Site U1617 was to drill a single hole using the rotary core barrel (RCB) system through a total sediment column that was expected to be about 460 m thick and sample an additional 70 m of basement rocks. After coring, downhole geophysical logging was planned in the same hole to complement the core recovery and to collect in situ measurements of formation physical properties.
This initial plan had to be modified after major drilling problems that resulted in the loss of two RCB bottom-hole assemblies (BHAs) at Sites U1612 and U1614, leaving us with only one remaining crossover drill collar to build an RCB BHA. Because we intended to drill at least one more RCB hole in the Vavilov Basin after the Campania Terrace site, we decided not to use the RCB system at Site U1617 to avoid the possibility of losing the last RCB BHA available. Previous DSDP and ODP expeditions in the Tyrrhenian generally did not encounter significant issues drilling the Messinian evaporites. However, during ODP Leg 107, the drill string became stuck in Hole 654A (Upper Sardinia margin) while drilling through an unstable conglomerate layer beneath Messinian evaporites and could be freed only after 3.5 h of strenuous efforts (Shipboard Scientific Party, 1987b). Attempting to reach the basement below the Messinian at Site U1617 may carry the same risk. The drilling plan at Site U1617 was therefore modified to core a single advanced piston corer (APC)/extended core barrel (XCB) hole going as deep as possible through the Messinian deposits and possibly reaching the basement. Drilling operations would be stopped as soon as problems were encountered or if the drilling rates became too slow. Although drilling with the APC/XCB system would be unlikely to achieve significant basement penetration, it would have the advantage of recovering a high-quality stratigraphic record. Once cored, the hole would be logged as originally planned.
2. Operations
Hole locations, water depths, and coring statistics for Site U1617 are listed in Table T1. All times are provided in local ship time (UTC + 1 h).
2.1. Hole U1617A
The 40.1 nmi transit from Site U1616 to Site U1617 was completed at an average speed of 10.4 kt, with the vessel arriving at 2150 h on 12 March 2024 and switching from cruise to dynamic positioning (DP) mode. The precision depth recorder (PDR) gave a water depth reading of 2822.3 m. After tripping the pipe to the seafloor, we spaced out and spudded Hole U1617A at 0715 h on 13 March, confirming a water depth of 2822.3 m. Coring was conducted with the APC/XCB system using a 163.5 m long BHA and a 9⅞ inch polycrystalline diamond compact bit. The mudline Core 1H advanced 4.5 m with 100% recovery. Coring continued smoothly until Cores 15H, 16H, 20H, and 21H, which were partial strokes where the drill bit was advanced by recovery. Cores 22F through 27F were then collected as half-length APC (HLAPC) cores. Cores 16H through 27F all experienced overpull ranging 12,000–40,000 lb. Therefore, we switched to the XCB system starting with Core 28X. Cores 28X and 30X through 35X had over 100% recovery, but Cores 29X, 36X, and 37X had low recovery. The rate of penetration slowed considerably starting in Core 36X, and a lithologic change to evaporite deposits was noted. All cores after Core 36X were taken as half advances to improve recovery and because of the slow penetration rates. Coring continued through Core 47X to a final depth of 339.9 m core depth below seafloor, Method A (CSF-A). Although we did not achieve the objective of tagging the basement, the hole was terminated to save time and because the thickness of the evaporite deposits could not be accurately evaluated from the seismic data.
In total, Hole U1617A recovered 304.2 m of sediment from the 339.9 m of advance (89%). APC and HLAPC cores recovered 217.74 m of sediment (104%), and XCB cores recovered 86.42 m (66%). The third-generation advanced piston corer temperature (APCT-3) tool was used to measure in situ formation temperature during drilling of Cores 4H, 7H, and 10H. Nonmagnetic core barrels were used for all APC cores, and all full-length APC cores were oriented. The perfluorocarbon microbial contamination tracer was pumped with the drilling fluid throughout.
Upon completion of coring in Hole U1617A, the hole was conditioned for downhole logging by pumping a sweep of high-viscosity mud. The drill pipe was tripped up to a bit depth of 74.6 m CSF-A and the triple combination (triple combo) tool string was deployed to log the open hole. At 0500 h on 16 March, with the triple combo tool string at 135.4 m CSF-A, the tool string encountered an obstruction and this first logging attempt was terminated. The tools were recovered and three stands of drill pipe were added to the drill string, bringing the bit depth to 151.7 m CSF-A, past the initial obstruction. At 0845 h, the triple combo tool string was deployed a second time; however, the tool string encountered an obstruction just outside of the bit and was unable to fully exit the drill pipe. The decision was made to stop logging attempts and pull out of the hole. At 2100 h, the rig floor was secured, the thrusters were raised, and we began the return trip to Site U1616 where we planned to install a reentry system and casing for the RCB system to drill in the basement.
2.2. Hole U1617B
Operations at Site U1616 occupied 17–27 March 2024. After encountering a formation that caused high torque and overpull in Hole U1616E and attempting to log the hole, we made the decision to return to Site U1617 and drill a second hole that would penetrate beyond the Messinian deposits into pre-Messinian sediments and/or basement. Because of the poor recovery with the XCB system in Hole U1617A, the plan was to drill ahead to 250 m CSF-A with an RCB bit and then core with the RCB system until we reached the sediment/basement interface. The return transit from Site U1616 to U1617 included surveying with the 3.5 and 12.0 kHz sonar systems, crossing perpendicular to a series of ridges that may have formed during the detachment faulting. In all, the transit was 57.7 nmi and took 5.3 h at a speed of 10.9 kt.
Upon arrival at the site, we lowered the ship's thrusters and transitioned to DP mode. By 1600 h on 27 March, we were positioned over the coordinates for Hole U1617B, which was offset ~20 m north of Hole U1617A. We set up a 157.2 m long BHA with a 9⅞ inch C-7 RCB bit and began tripping the pipe to the seafloor. Hole U1617B was spudded at 2330 h on 27 March. Drilled interval 11 in Hole U1617B penetrated to 250.0 m CSF-A and was completed at 1030 h on 28 March, before recovering the center bit to start coring.
RCB drilling in Hole U1617B progressed from 250.0 to 370.4 m CSF-A with Cores 2R–22R. Recovery was high in Cores 2R–5R (ranging 89%–126%), but only 10% in Core 6R. Cores were drilled as half advances starting from Core 7R to improve recovery. The low recoveries are attributable to the evaporite and halite lithologies. The final core, Core 22R, crossed a lithologic boundary from halite to a black shale that was observed on the catwalk to have a strong petroleum smell. Coring operations were paused while the headspace gas safety measurement for hydrocarbon content and composition was completed. The sample was found to have an anomalously low ratio of methane/ethane, indicating a possible thermogenic origin, and further drilling in Hole U1617B was halted. Overall, coring in Hole U1617B advanced 120.4 m and recovered 68.6 m of sediment, evaporites, and shale (57%).
Preparations then began to log Hole U1617B using the triple combo and Formation MicroScanner (FMS)-sonic tool strings. Drill fluid was circulated through the hole and the core barrel, which had been deployed prior to cessation of coring operations. Pipe was tripped up to 311.6 m CSF-A and a 40 bbl sweep of sepiolite mud was pumped. The pipe was then tripped back down to 370.4 m CSF-A and the rotary shifting tool was deployed to release the RCB bit at hole bottom. Finally, the pipe was set at 279.9 m CSF-A and the triple combo tool string was deployed at 1700 h on 30 March. The tool string encountered an obstruction at 328.4 m CSF-A that could not be worked through, and the tool string was recovered. Because we did not reach sufficient depth to open the caliper on the triple combo and measure the hole diameter, we could not run the FMS tool and instead ran the Dipole Sonic Imager (DSI) without the FMS. The sonic tool successfully passed down to the obstruction at 328.4 m CSF-A, then completed an up log. By 0445 h on 31 March, the tool string had been recovered and rigged down.
We picked up the top drive and washed down past the obstruction to the hole bottom, then continued to circulate while pulling the pipe up to 336.8 m CSF-A with the goal of conducting a second logging run to the full depth of the hole. The triple combo tool string was deployed at 1045 h on 31 March, with the caliper and density tools removed to shorten the tool string and maximize the depth of data recorded by the other tools. The triple combo tool string reached 364 m CSF-A, near the hole bottom at 370.4 m CSF-A. It was then recovered and the hole displaced with heavy mud due to the anomalous methane/ethane ratio.
Pipe was tripped back to the surface and the rig floor was secured for transit at 2248 h, ending Site U1617. The vessel transitioned from DP to cruise mode and the transit to return to Site U1616 and deepen Hole U1616E began at 2305 h on 31 March.
3. Lithostratigraphy
Operations at Site U1617 cored two holes covering overlapping intervals of the sediment succession. Hole U1617A cored a 339.9 m thick sequence of sediment with a total recovery of 89% (Figure F3). Hole U1617B cored a 120.4 m thick sequence of sediment with a total recovery of 57% (Figure F3). Site U1617 is located on the lower slope of the Campania Terrace and is therefore not strongly influenced by clastic deposition (like the Vavilov Basin sites). Tephra intervals are thus well preserved in the sedimentary succession. The cored sediment was divided into three major lithologic units ranging in age from present to Messinian based on shipboard nannofossil and planktic foraminifera biostratigraphy (Figures F4, F5).

Figure F3. Lithostratigraphic summary.

Figure F4. VCDs.

Figure F5. Main lithology core images.
Lithostratigraphic units are based on lithologic changes reported in the visual core description (VCD) forms (Figure F4), smear slide observations (Figure F6), physical properties, carbonate analysis (total organic carbon [TOC] and calcium carbonate [CaCO3]), and mineralogy as measured by X-ray diffraction (XRD). The observed lithologic differences correspond to color changes (identified using Munsell Color Chart) that reflect major changes in mineralogical and/or biogenic components.

Figure F6. Main lithology smear slides.
Unit I (present to Late Pliocene) is divided into three subunits based on the abundance of volcaniclastic material (primarily tephra deposits) and sapropel/organic-rich layers, and all subunits are mainly pelagic deposits. Unit II consists of Early Pliocene age nannofossil ooze with numerous intervals of foraminifera-rich nannofossil ooze. Unit III is Messinian in age and contains several lithologies, including evaporite deposits. As a result of good core recovery, lithologic primary contacts were recovered in some cases, such as between Unit II and Unit III (Messinian deposits). Biostratigraphy, core observations, and structural measurements, however, revealed the presence of soft-sediment deformation that had caused some hiatuses and possible repetition of strata in the upper part of the sedimentary column (Unit I; see Biostratigraphy and Structural geology). To account for occasional >100% core recovery, we applied the core depth below seafloor, Method B (CSF-B), depth scale at Site U1617.
3.1. Unit descriptions
3.1.1. Lithostratigraphic Unit I
3.1.1.1. Lithostratigraphic Subunit IA
- Interval: 402-U1617A-1H-1 through 11H-CC
- Depth: 0–99.45 m CSF-B
- Age: Holocene to Early Pleistocene (present to Calabrian)
- Major lithologies: nannofossil ooze, tephra, sapropel, organic-rich mud, glauconite-rich nannofossil ooze
The sediment/water interface contained abundant pteropod shells. The upper 105 cm of Subunit IA still contains measurable oxygen in the interstitial waters (IWs) (see Microbiology). Farther downhole, the sedimentary succession alternates turbiditic episodes with pelagic sedimentation. Tephra deposition is common, reflected in high but scattered magnetic susceptibility (MS) values and low reflectance because the ash layers are mostly thin and dispersed (Figures F4, F7). Several sapropel layers are present and locally rich in TOC (e.g., Sample 402-U1617A-6H-5, 118 cm; TOC = 5.33%). These sapropels are well preserved (Figure F8) and are also locally very rich in foraminifera. Cross-core contamination is occasionally present, mostly affecting the coarser layers. Glauconite-rich layers are disseminated throughout the subunit and may reflect several factors such as low sediment deposition rates and subsequent long residence time of the sediments near the seafloor and/or high input of organic matter.

Figure F7. GRA bulk density and L* data.

Figure F8. MTDs and sapropel layers.
Several features that may be associated with slumps and mass transport deposits (MTDs) are distributed throughout Subunit IA, with extensive soft-sediment deformation structures in Cores 402-U1617A-4H, 6H, 8H, 10H (Figure F8). A debris flow with mud clasts is also present in Section 6H-2. Bioturbation is generally low, possibly due to multiple MTDs resulting in unstable seafloor conditions for the benthic fauna to thrive.
3.1.1.2. Lithostratigraphic Subunit IB
- Interval: 402-U1617A-12H-1 through 19H-CC
- Depth: 99.45–170.65 m CSF-B
- Age: Early Pleistocene to Late Pliocene (Calabrian to Piacenzian)
- Major lithologies: nannofossil ooze, sapropel, organic-rich mud
Subunit IB was distinguished from Subunit IA based on two factors: (1) the limited presence of tephra layers and (2) the lower frequency of MTDs. Nannofossil oozes intercalated by layers of sapropel (Figure F5) and glauconite-rich patches constitute the main lithology described in most of the cores. The increase in compaction toward the bottom of Subunit IB is reflected in higher gamma ray attenuation (GRA) bulk density values (Figure F4). Increasing compaction may also explain the core expansion observed downhole, which is evident in Cores 402-U1617A-14H, 15H, 16H, 19H. In two of the thin ash layers found in Subunit IB (Sections 402-U1617A-13H-4 and 13H-5; Figure F4), distinct white layers are present. Smear slide analysis revealed that these white layers are entirely made of pentagonal plates of the calcareous nannofossil Braarudosphaera bigelowii, indicating a possible bloom during ash deposition (Figure F9A). Because of the quieter depositional environment, bioturbation is more common in Subunit IB, with horizontal burrows that are larger than pseudovertical burrows. Pyrite is also present throughout Subunit IB (Figure F9B).

Figure F9. Distinctive features of Subunits IA and IB and Unit III.
3.1.1.3. Lithostratigraphic Subunit IC
- Interval: 402-U1617A-20H-1 through 24F-CC
- Depth: 170.65–195.95 m CSF-B
- Age: Late to Early Pliocene (Piacenzian to Zanclean)
- Major lithologies: nannofossil ooze, tephra, nannofossil ooze with foraminifera
Subunit IC is mostly composed of nannofossil ooze, but with an increased abundance of tephra relative to Subunit IB, as indicated by the MS values (Figure F4). Several tephra layers that have undergone diagenetic alteration show greenish bands of diagenetic clays, precipitated in a reaction rim around the tephra layers. Bioturbation is moderate to locally intense.
3.1.2. Lithostratigraphic Unit II
- Intervals: 402-U1617A-25F-1 through 34X-4; 402-U1617B-2R-1 through 3R-CC
- Depths: Hole U1617A = 195.95–269 m CSF-B; Hole U1617B = 250–262.8 m CSF-B
- Age: Late to Early Pliocene (Piacenzian to Zanclean)
- Major lithologies: foraminifera-rich nannofossil ooze, nannofossil ooze
Nannofossil ooze with brownish/greenish stains and dark gray bioturbation burrows is present throughout Unit II, locally alternating with foraminifera-rich nannofossil ooze. Carbonate content from shipboard analyses is high (reaching up to 59%; see Sediment and interstitial water geochemistry), compared to the upper part of this hole, where terrigenous input was greater. Occasional pyrite clusters and nodules are present with remineralization of bioturbated burrows. From Core 402-U1617A-28X downhole, the sediments are strongly disturbed by biscuiting due to the change from the HLAPC to XCB coring systems. Bioturbation is pervasive in the whole unit, both as chondrites as well as larger zoophycos burrows. In Core 34X we detected the transition from pelagic to mostly shallow-water depositional environments (Figure F10). This section contains material equivalent to the pyritic marl described extensively during DSDP Leg 13 and ODP Leg 107, marking the Miocene/Pliocene boundary. This transition is clearly reflected by the onboard physical property measurements, where both the natural gamma radiation (NGR) and GRA bulk density values suddenly increase (Figure F4) and also by the inductively coupled plasma–atomic emission spectrometry (ICP-AES) analyses showing high concentrations of iron and silica at and below the boundary (Table T10). Reddish colors correspond to oxide-rich sediments, possibly exposed subaerially and leached from the pyrite-rich layer. The evaporitic facies show no bioturbation, whereas the first three sections of this core are intensely affected by it.

Figure F10. Representative XRD diffractograms.
3.1.3. Lithostratigraphic Unit III
3.1.3.1. Lithostratigraphic Subunit IIIA
- Intervals: 402-U1617A-34X-4 through 44X-CC; 402-U1617B-4R-1 through 13R-2
- Depths: Hole U1617A = 269–326.4 m CSF-B; Hole U1617B = 262.8–323.27 m CSF-B
- Age: Late Miocene (Messinian)
- Major lithologies: oxide-, dolomitic-, and organic-rich mud, gypsum, nannofossil-rich silt, black shale, nannofossil-rich mud, clay with dolomite
The lithologies that comprise Subunit IIIA are typical of environments characterized by a strong detrital input (relatively close to the continent), alternating between gypsiferous and terrigenous deposition, as indicated by the presence of wood fragments, ostracods, and dwarfed fauna (Figure F9C). The evaporitic facies are represented by several gypsum-rich layers, which have been tentatively categorized based on shipboard data and XRD measurements as: (1) selenitic gypsum dispersed in mud matrix, (2) gypsum rosettes, (3) fibrous gypsum, (4) finely laminated gypsum, (5) microcrystalline gypsum, and (6) detrital gypsum (Figure F11).

Figure F11. Evaporitic lithologies.
Dark gray, finely laminated silts and siltstones (dolomitic-rich) with sparse nannofossils, plant remains, and ostracods alternate with the evaporitic deposits, possibly highlighting periods of higher terrigenous input at this site (i.e., Lago Mare facies). Two distinct intervals of black shale recovered in Core 402-U1617A-38X have a high TOC content (>2%) but a very low total nitrogen (TN) content, indicating organic matter of terrestrial origin. In Hole U1617A, drilling disturbance in the XCB coring heavily affected the sedimentary structures, possibly exacerbated by the different hardnesses of gypsum and siltstone, whereas RCB coring in Hole U1617B provided better core quality. Gypsum is clearly highlighted by the moisture and density (MAD) measurements, with porosity values between 31% and 37% and grain densities of 2.60–2.66 g/cm3.
3.1.3.2. Lithostratigraphic Subunit IIIB
- Intervals: 402-U1617A-45X-1 through 47X-CC; 402-U1617B-13R-2 through 18R-1
- Depths: Hole U1617A = 326.4–339.9 m CSF-B; Hole U1617B = 323.27–346.54 m CSF-B
- Age: Late Miocene (Messinian)
- Major lithologies: anhydrite, organic-rich mud, gypsum with anhydrite, oxide-rich anhydrite, mudstone
The evaporitic facies in Subunit IIIB are represented by several anhydrite-rich layers, which have been tentatively categorized based on shipboard data and XRD measurements as: (1) nodular anhydrite, (2) massive chicken-wire anhydrite, and (3) finely laminated anhydrite (Figure F11).
The nodular anhydrite is dispersed in a dolomitic-rich mud, and the massive anhydrite is locally oxide-rich (red/pink hues) or contains gypsum inclusions, possibly linked to diagenetic processes. Pressure-solution structures are also common. Several deformation structures are present, related to faulting and folding (see Structural geology). Fall-in clasts of mudstones are present (e.g., in Sections 402-U1617A-16R-1 and 17R1). Anhydrite can be clearly distinguished on the basis of the MAD measurements, with porosity values between 6% and 11% and grain densities of 2.91–2.99 g/cm3.
3.1.3.3. Lithostratigraphic Subunit IIIC
- Interval: 402-U1617B-18R-2 through 22R-2
- Depth: 346.54–370.4 m CSF-B
- Age: Late Miocene (Messinian)
- Major lithologies: halite, black shale, gypsum
The evaporitic facies in Subunit IIIC is represented by halite intercalated by anhydrite, often contorted and deformed, underlain by finely laminated gypsum (Figure F11). Together with DSDP Leg 13 Site 134 (The Shipboard Scientific Party, 1973a), Subunit IIIC is one of the few recovered occurrences of Messinian halite in marine sediments of the Western Mediterranean. The deepest sediments recovered in Hole U1617B consist of organic-rich black shale (TOC = 2.56%–2.83%). Site 134 also cored organic-rich black shale beneath the halite interval.
4. Biostratigraphy
Calcareous nannofossil and planktic foraminifera specimens extracted from core catcher and core samples were analyzed to develop a biostratigraphic framework for Site U1617. Core recovery in Hole U1617A was 89%, the best of any site during Expedition 402. The age constraints and biozonal boundaries across the sedimentary successions were established by analyzing the semiquantitative data from very well preserved calcareous nannofossil and planktic foraminiferal assemblages. The Mediterranean biozonation schemes of Di Stefano et al. (2023) and Lirer et al. (2019) were used for this purpose.
4.1. Planktic foraminifera
4.1.1. Hole U1617A
4.1.1.1. Sedimentary compositions of collected samples
Sediment samples were collected primarily from Sections 402-U1617A-1H-CC through 36X-CC. Core catcher samples were washed with a 63 µm sieve to remove clay and/or silt particles. Residues were dried, further sieved through a 125 µm sieve to filter out any juvenile microfossil species, and analyzed under a microscope. The extracted residues (>125 µm) contain calcareous oozes rich with well-preserved planktic foraminiferal assemblages. Foraminiferal abundances were observed to be very high compared to all the other sites of the expedition. Benthic foraminifera, ostracod, and radiolarian species were also observed, along with broken molluscan shell fragments. Although the taxonomy and abundance of these species were not recorded because of time constraints, their presence provides valuable information for future analysis.
The ~340 m thick sediment interval recovered in Hole U1617A was determined to be Holocene–Late Miocene (late Messinian stage) in age. These sedimentary sequences were continuous between Samples 402-U1617A-1H-CC and 13H-CC and were followed by a temporal hiatus of ~0.5 Ma with the upper Gelasian stage (corresponding to the MPl6b zone) missing, as determined from the planktic foraminiferal record. The sedimentary successions below this interval were continuous to Sample 33X-CC. The sediments from Samples 34X-CC and 35X-CC were organic-rich silt and oxide mud, respectively, and were washed away completely through the 63 µm sieve and contained no planktic foraminifera. Samples 34X-CC to 47X-CC were later determined to be Messinian deposits containing evaporite minerals such as gypsum and/or anhydrite based on previous research in and around these regions (Cita et al., 1990; Roveri et al., 2008). No planktic foraminifera were found in these samples.
4.1.1.2. Planktic foraminifera biozonation
Planktic foraminifera marker species were examined from samples collected in Hole U1617A, and biozones were assigned according to the biozonation scheme described in Lirer et al. (2019). The biostratigraphic zonation scheme used in Hole U1617A is presented in Table T2 and is consistent with the nannofossil biostratigraphy observed at Site U1617.
The fauna within the fossiliferous calcareous ooze zones (Samples 402-U1617A-1R-CC to 33R-CC) are typical of the Mediterranean Biostratigraphic MPle2b–MPl3 zones, which are primarily composed of the marker species Neogloboquadrina pachyderma (sin), Globigerina bulloides, Globigerina umbilicata, Globigerinella siphonifera, Globigerinoides ruber var. white, G. ruber var. pink, Globigerinoides rublobatus, Globoconella inflata, Globorotalia bononiensis, Globoconella puncticulata, Globorotalia margaritae, Globorotalia excelsa, Globigerinella calida, Globigerinoides extremus, Globigerinoides obliquus, Globorotalia crassaformis, Neogloboquadrina incompta, Neogloboquadrina atlantica, Neogloboquadrina acostaensis, Globorotalia scitula, Trilobatus quadrilobatus, Trilobatus sacculifer, and Orbulina universa (Figures F12, F13, F14, F15, F16).

Figure F12. Planktic foraminifera.

Figure F13. Planktic foraminifera.

Figure F14. Planktic foraminifera.

Figure F15. Planktic foraminifera.

Figure F16. Planktic foraminifera.
Biozones were delineated based on the faunal succession of marker species as defined below.
4.1.1.2.1. Zone MPle2b
Samples 402-U1617A-1H-CC to 3H-CC were assigned to the MPle2b subzone based on the dominant presence (acme occurrences) of G. calida (Figure F16) and first occurrence of G. ruber var. pink species (~0.33 Ma; Sample 3H) (Figure F13), along with the very commonly occurring Late Neogene species G. bulloides (Figure F12) and O. universa (Figure F16).
4.1.1.2.2. Zone MPle2a
Samples 402-U1617A-4H-CC and 5H-CC were assigned to the MPle2a subzone coincident with the influx of G. excelsa (~0.78 Ma; Sample 6H) (Figure F14) and the common occurrence of G. calida species.
4.1.1.2.3. Zones MPle1c–MPle1b
Samples 402-U1617A-6H-CC to 10H-CC were assigned to the MPle1c and MPle1b zones coincident with the first common occurrence of G. excelsa (~1 Ma), paracme top (~1.21 Ma; Sample 6H), paracme base (~1.37 Ma; Sample 10H), occurrence of Neogloboquadrina spp. (sin), last common occurrence of G. rublobatus, and acme occurrences of G. bulloides species.
4.1.1.2.4. Zone MPle1a
Samples 402-U1617A-11H-CC to 13H-CC were assigned to the MPle1a zone coincident with the acme occurrences of G. rublobatus and common occurrences of G. bulloides and Neogloboquadrina spp. (sin) species.
4.1.1.2.5. Zone MPl6b
There is a ~0.5 Ma hiatus present below the MPle1a zone as indicated by the absence of the prominent species Globorotalia truncatulinoides planktic foraminifera marker events. Therefore, the MPl6b zone was inferred to be missing from the sediment succession.
4.1.1.2.6. Zone MPl6a
Samples 402-U1617A-14H-CC and 15H-CC were associated with the MPl6a zone coincident with the first occurrences of G. inflata (~2.09 Ma; Sample 15H) and G. rublobatus (~2 Ma; Sample 14H) and last occurrence of G. bononiensis (~2.29 Ma; Sample 15H) species.
4.1.1.2.7. Zone MPl5b
Samples 402-U1617A-16H-CC to 18H-CC were assigned to the MPl5b zone as the last occurrence of G. extremus (~2.57 Ma) and N. atlantica (~2.41 Ma), along with commonly occurring G. obliquus species.
4.1.1.2.8. Zone MPl5a
Samples 402-U1617A-19H-CC to 27F-CC were associated with the MPl5a zone recognized from the common occurrences of G. bononiensis, reappearance of common (10–50 individuals) G. crassaformis, and acme (Sample 21H-CC) and first common occurrence (~2.72 Ma; Sample 25F-CC) of the N. atlantica species.
4.1.1.2.9. Zone MPl4c
Samples 402-U1617A-28X-CC and 29X-CC were assigned to the MPl4c zone based on the first common occurrence (~3.31 Ma) of G. bononiensis species.
4.1.1.2.10. Zone MPl4b
Sample 402-U1617A-30X-CC was assigned to the MPl4b zone coincident with the first occurrence (~3.59 Ma) of G. bononiensis and declining numbers (≤10 individuals) of G. crassaformis species.
4.1.1.2.11. Zone MPl4a
Sample 402-U1617A-31X-CC was assigned to the MPl4a zone coincident with the last occurrence (~3.57 Ma) of G. puncticulata and first common occurrence (~3.6 Ma) of G. crassaformis species.
4.1.1.2.12. Zone MPl3
Samples 402-U1617A-32X-CC and 33X-CC were associated with the MPl3 zone, where G. puncticulata and G. margaritae commonly occur. The zone was dated to be younger than 4.5 Ma when G. puncticulata first appeared.
4.1.1.2.13. Zone MPl2 and below
Samples 402-U1617A-34X-CC and 35X-CC were organic-rich silt and oxide-rich mud sediments that were completely washed away by the 63 µm sieve. Therefore, no planktic foraminifera species could be observed to detect marker events from these layers. Samples 36X-CC to 47X-CC were observed to contain evaporite minerals such as gypsum and anhydrite and were recognized to be Messinian deposits (younger than 6.033 Ma). No planktic foraminifera were recognized in these lower sedimentary layers.
4.1.2. Hole U1617B
Core catcher samples were not collected from the pre-Messinian and Messinian evaporite sedimentary sequences in Hole U1617B. Samples 402-U1617B-2R-CC and 3R-CC were collected and observed to be stratigraphically concurrent to Samples 402-U1617A-33X-CC and 34X-CC.
Based on the first occurrence of G. margaritae and common occurrences of G. extremus and G. obliquus species, Sample 402-U1617B-2R-CC was assigned to the MPl2 biozone. Sediment sampled in Section 3R-CC was completely washed away from the sieve and was interpreted as oxide-rich mud. This layer was interpreted to be near the top of the Messinian deposits.
4.2. Calcareous nannofossils
Calcareous nannofossils were analyzed in 35 core catcher samples from Hole U1617A and from additional toothpick samples of Core 34X to improve the age determination of the sediments recovered near the top of the Messinian. Biozones were assigned using the Mediterranean biozonation scheme described in Di Stefano et al. (2023).
Figure F17 contains the list of the samples examined and the biozonal assignment.

Figure F17. Calcareous nannofossil biozones.
The mudline sample from Hole U1617A contains a well-preserved nannofossil assemblage characterized by the presence of Emiliania huxleyi (MNQ21 biozone; Middle Pleistocene–Holocene; younger than 0.25Ma). Samples 1H-CC and 2H-CC were assigned to the Middle–Upper Pleistocene MNQ20 biozone (0.26–0.46 Ma) because of the presence of abundant and well-preserved nannofossil assemblages composed predominantly of small-sized Gephyrocapsa, middle-sized Gephyrocapsa, Helicosphaera carteri, Helicosphaera inversa, Calcidiscus leptoporus, Coccolithus pelagicus, Coronosphaera spp., and Syracosphaera pulchra.
Sample 402-U1617A-6H-CC was assigned to the upper Calabrian (Early Pleistocene) MNQ19c subzone (0.96–1.24 Ma), characterized by the presence of dominant small-sized Gephyrocapsa and H. carteri and Helicosphaera sellii, C. leptoporus, Calcidiscus macintyrei, Pseudoemiliania lacunosa, and Geminilithella (Umbilicosphaera) rotula. In this interval, the estimated sedimentation rate is about 40 m/My.
Samples 402-U1617A-7H-CC to 9H-CC were assigned to the MNQ19d biozone, and Sample 10H-CC was assigned to the MNQ19c biozone, indicating a repetition in the sedimentary succession.
Sample 402-U1617A-11H-CC was assigned to the lower Calabrian (Early Pleistocene) MNQ19b subzone (1.24–1.61 Ma) characterized by the presence of large-sized Gephyrocapsa, H. carteri, H. sellii, C. leptoporus, C. macintyrei, P. lacunosa, and G. (U.) rotula.
Samples 402-U1617A-12H-CC and 13H-CC were assigned to the lower Calabrian (Early Pleistocene) MNQ19a biozone (1.61–1.71 Ma), which is marked by the first occurrence of middle-sized Gephyrocapsa.
None of the samples were assigned to the MNQ18 zone (1.95–1.71 Ma), at the Gelasian–Calabrian transition (Early Pleistocene).
Samples 402-U1617A-14H-CC to 17H-CC contain very well preserved and abundant nannofossil assemblages characterized by abundant specimens of Discoaster brouweri and Discoaster triradiatus, indicating the Gelasian (Early Pleistocene) MNQ17 biozone (2.52–1.95 Ma).
Samples 402-U1617A-18H-CC and 19H-CC contain nannofossil assemblages with many species of the Discoaster genus, such as D. brouweri, Discoaster pentaradiatus, and Discoaster surculus, assigned to the MNN16 biozone (2.82–2.51 Ma) at the Pliocene/Pleistocene boundary (Piacenzian/Gelasian).
Samples 402-U1617A-20H-CC to 23F-CC were assigned to the Upper Pliocene (Piacenzian) MNN15b zone (2.82–3.56 Ma) because of the presence of well-preserved nannofossil assemblages that include Discoaster asymmetricus and Discoaster tamalis but exclude D. pentaradiatus (D. pentaradiatus paracme event).
Samples 402-U1617A-24F-CC to 28F-CC were found to belong to the Upper Pliocene (Zanclean–Piacenzian transition) MNN15a zone (3.56–3.85 Ma) because of the presence of abundant D. pentaradiatus in the nannofossil assemblages.
Samples 402-U1617A-29X-CC to 31X-CC were assigned to the Lower Pliocene (Zanclean) MNN14 zone (3.85–4.11 Ma; assemblage: Amaurolithus delicatus, C. pelagicus, C. leptoporus, D. asymmetricus, D. brouweri, D. tamalis, D. pentaradiatus, G. [U.] rotula, H. carteri, H. sellii, Reticulofenestra pseudoumbilicus, and Sphenolithus spp.).
Sample 402-U1617A-32X-CC was assigned to the Lower Pliocene (Zanclean) MNN13 biozone (4.11–4.62 Ma; assemblage: C. pelagicus, C. leptoporus, D. brouweri, D. surculus, D. pentaradiatus, Discoaster variabilis, G. [U.] rotula, H. carteri, H. sellii, R. pseudoumbilicus, and Sphenolithus spp.), and Sample 33X-CC was assigned to the Lower Pliocene (earliest Zanclean) MNN12 biozone (4.62–5.33 Ma; assemblage: C. pelagicus, C. leptoporus, D. brouweri, D. surculus, D. pentaradiatus, D. variabilis, G. [U.] rotula, H. carteri, H. sellii, Reticulofenestra zancleana, and Sphenolithus spp.).
The sedimentation rate calculated in the interval from Samples 402-U1617A-14H-CC to 33X-CC is about 43 m/My.
No nannofossils were observed in Sample 402-U1617A-34X-CC, but oxides and calcite granules were identified. Additional samples from Core 34X were analyzed to define the boundary between the Pliocene sediments and the Messinian, which falls between Sample 34X-4, 70 cm, and 34X-4, 107 cm. This finding agrees with sedimentologic and physical properties data.
Samples 402-U1617B-2R-CC and 3R-CC were assigned to the MNN12 biozone (4.62–5.33 Ma; assemblage: C. pelagicus, C. leptoporus, D. brouweri, D. surculus, D. pentaradiatus, D. variabilis, G. [U.] rotula, H. carteri, H. sellii, R. zancleana, and Sphenolithus spp.).
4.3. Synthesis from microfossil data
The data presented here imply that the upper part of Hole U1617A (to ~50 meters below seafloor [mbsf]) is represented by an almost complete succession of Calabrian–Holocene age that was deposited with an average sedimentation rate of ~40 m/My. From ~50 to ~120 mbsf, the succession ranges from Chibanian to early Calabrian (average sedimentation rate of ~51 m/My), but the interval 50–90 mbsf contains the same biozones as those at 15–50 mbsf, indicating a repetition in the succession, probably due to a slump or MTD. This interval is followed below by a temporal hiatus corresponding to the MNQ18 biozone (about 0.2 Ma).
The lower part of Hole U1617A (~120–269 mbsf) contains an almost complete succession of Gelasian–Zanclean age that is characterized by an average sedimentation rate of ~43 m/My. The Messinian/Zanclean boundary was detected at about 269 mbsf in Section 402-U1617A-34X-4.
5. Paleomagnetism
5.1. Paleomagnetic results
Paleomagnetic analyses were conducted on 47 cores recovered from Hole U1617A using the APC/XCB system and on 21 RCB cores recovered from Hole U1617B. Natural remanent magnetization (NRM) was measured at 2 cm intervals on section halves before and after demagnetization at 5, 10, 15, and 20 mT peak alternating field (AF). The NRM shows dominant normal polarity (Figure F18), and the peak of the inclination histogram is at a higher value than the expected geocentric axial dipole (GAD) field value (Ic_GAD = 59.21°) (Figure F19) at the borehole latitude (40°0.0211′N). Demagnetization of NRM at 20 mT peak AF (NRM@20mT) yields an inclination histogram that peaks closer to the expected GAD value (Figure F19), and the fraction of data with transitional and reverse polarity becomes more pronounced than that in the NRM data (Figure F18).

Figure F18. NRM variation, Hole U1617A.

Figure F19. NRM and NRM@20mT inclination.
Many sporadic reversals are observed in the interval from the seafloor through Core 402-U1617A-19H (161.2 m CSF-B). Some of these reversals are associated with minor lithologic changes; for example, we document some reversals associated with sapropel layers (Section 11H-2; 91.434 m CSF-B) and tephra layers (Section 11H-3; 92.928 m CSF-B). Some reversals are found in the predominantly normal nannofossil ooze, but these reverse intervals are often a different color, indicating mineralogical or chemical differences that can be better explored after the expedition (e.g., Sections 12H-3 [102.419 m CSF-B] and 16H-2A [136.635 m CSF-B]). One of the most persistent intervals with reverse polarity is found in Section 18H-4 (158.573 m CSF-B), which is an interval of nannofossil ooze about 120 cm thick. Between Cores 27F (~161.2–209.7 m CSF-B) and 34X (264 m CSF-B), NRM@20mT with normal polarity is characterized by a much lower inclination than the GAD value, with some measured inclinations close to 0°. In particular, Core 32X is characterized by transitional (inclination close to 0°) and reverse polarities.
Messinian deposits occur below Sections 402-U1617A-34X-4 (269 m CSF-B) and 402-U1617B-4X-1 (262.8 m CSF-B) (Lithostratigraphic Unit III; see Lithostratigraphy). The boundary marks a sharp decrease in the NRM intensity in Holes U1617A (Figure F18) and U1617B (Figure F20). Although the polarity of the geomagnetic field changes across the Messinian/Zanclean boundary from reverse in the Messinian (Subchron C3r) to normal in the Zanclean (Subchron C3n.4n) (Gradstein et al., 2020), the upper ~20 m of the Messinian unit in Holes U1617A and U1617B shows persistent normal polarity (Figures F18, F20), indicating that the paleomagnetic records were reworked. Below these upper intervals, NRM drops to extremely low intensity and the quality of the NRM degrades, showing a random variation in downhole inclination that does not reflect geomagnetic reversals.

Figure F20. NRM variation, Hole U1617B.
5.2. Rock magnetic properties
As illustrated by the NRM of Messinian deposits and by the fact that the normal polarity intervals predominate over those with reverse polarity, the paleomagnetic records at Site U1617 have been pervasively reworked, as indicated by the results of discrete samples. Discrete cube samples were subjected to AF demagnetization up to 120 mT peak AF to assess the quality of NRM data obtained from archive-half sections. Principal component analysis (PCA) was used to define the characteristic remanent magnetization (ChRM) (Kirschvink, 1980). Data from the 30 and 80 mT intervals were used to determine ChRM inclination and the associated maximum angular deviation, which indicates the quality of ChRM. The ChRM inclination of discrete samples is similar to the values measured in the archive halves (Figure F18). For example, the interval with transitional inclinations (inclination being close to 0°) seen between Cores 402-U1617A-26F (200.3 m CSF-B) and 34X (264.00 m CSF-B) is also found in the discrete samples. However, in three samples in Unit II (between 195.95 and ~269 m CSF-B) ChRM shows a steeper inclination than that of NRM@20mT (Figure F18), suggesting that NRM@20mT remains affected by secondary magnetization in a part of Unit II. Discrete samples from the Messinian unit in Hole U1617B do not provide quality maximum angular deviation values (i.e., >15°), confirming the poor NRM quality seen in the results from the archive-half sections (Figure F21).

Figure F21. NRM and ARM demagnetization.
The demagnetization patterns of NRM anhysteretic remanent magnetization (ARM) also suggest variable NRM quality. The median destructive field (MDF) of NRM, at which 50% of the initial magnetization is removed, ranges mainly between 5 and 40 mT, with a few exceptions that have higher MDFs. However, the MDF of ARM is much less variable, ranging mainly between 20 and 40 mT (Figure F22). Therefore, the variation in MDF observed from NRM demagnetization does not arise from the difference in the intrinsic properties of the remanence carriers; rather, it indicates that the primary NRM may have undergone some degree of postdepositional reworking. Consistent with this, the anisotropy of MS (AMS) measured in discrete samples shows highly scattered minimum axes of the MS ellipsoid for both Holes U1617A and U1617B (Figure F23), indicating sediment deformation, possibly gravitational slumps (see Structural geology). In addition, the Messinian deposits (Unit III) are characterized by very weak magnetization compared to other units (Figure F20). As a result, their ARM demagnetization curves are noisy and most appear to have a lower MDF than other samples (Figure F22), indicating that the few magnetic minerals in Unit III are of coarser grain size.

Figure F22. ARM demagnetization.

Figure F23. AMS.
5.3. Magnetostratigraphy
The base of the cored sediment column of Hole U1617A is of Messinian age (see Biostratigraphy), but the reworked paleomagnetic records do not allow for a clear correlation between the observed magnetozones and the geomagnetic polarity timescale (GPTS) (e.g., Gradstein et al., 2020). The most promising reversal record is that found in Section 402-U1617A-18H-4, which should correspond to Subchron C2r.2r (Gradstein et al., 2020) at an age of 2.595 Ma, constrained from biostratigraphy (see Biostratigraphy). However, given the pervasive NRM normal polarity overprint, it is highly uncertain whether this reversal captures the true Gauss/Matuyama reversal event between Subchrons C2An.1n and C2r.2r at 2.595 Ma.
6. Structural geology
Two holes were drilled at Site U1617 in the Campania Terrace. Hole U1617A recovered a ~340 m sedimentary sequence from present to Messinian deposits (recovery = 89%). In Hole U1617B, we drilled through the upper sedimentary column and started coring at ~30 m above the Messinian deposits. Hole U1617B drilled ~120 m of Lower Pliocene–Messinian deposits (recovery = 57%).
The sedimentary sequence in Hole U1617A consists mainly of finely laminated sediments interlayered by MTDs. No significant faults intersect the sedimentary sequence in Holes U1617A or U1617B. The sedimentary sequence was divided into three domains based on the bedding dip.
6.1. Domain I: subhorizontal present-Pliocene deposits
Site U1617 was completely drilled in sediments and sedimentary rocks from the seafloor to 370.4 mbsf. Structural geology measurements included the orientation of bedding, fractures, faults, and folds. The excellent recovery at this location allowed us to identify an angular unconformity at about 205 mbsf, which divides the succession into two structural domains: Domain I and Domain II (Figure F24). Domain I (Cores 402-U1617A-1H through 26F) is characterized by subhorizontal to very gently dipping beds, generally <20° with an average dip of 8°. In Domain I, we also identified several MTDs or slumps with highly tilted bedding (20°–72°; Figure F25), alternating with layers dipping < 20°. A few soft-sediment faults, both normal and reverse, and fractures were measured within the sequence, mostly correlating with the occurrence of MTDs (Figure F25).

Figure F24. Dip variation for bedding, faults, and fractures.

Figure F25. MTD.
6.2. Domain II: Pliocene–Messinian deposits
Domain II is characterized by a change in the sediment color from olive-gray to brighter colors from 234 mbsf in Hole U1617A (Core 27F downward) and at 268.8 mbsf in Hole U1617B (Cores 3R–21R). This domain contains the transition to Messinian deposits, including evaporitic facies with banded gypsum, anhydrite, and siltstones.
Domain II shows an increase of bedding dip with an average dip of 21° and maximum dips reaching 52°. In Holes U1617A and U1617B, this change is observed despite the strong drilling disturbance of the recovered sediments. This drilling disturbance is more intense in Hole U1617A, probably due to the XCB drilling method. In addition, Sections 402-U1617A-32X-1 through 32X-5 are disrupted by moderate to strong bioturbation, which makes it difficult to observe any potential structures.
In Hole U1617B, we observed many different deformation structures in the Messinian deposits, such as faults and folds, breccias, compaction structures, and veins (Figure F26). Faults are mostly normal, at a high angle to the core reference frame, with offsets ranging from a few millimeters to several centimeters (Figure F26A, F26B). Fractures are commonly related to MTDs. Folding occurs in mass waste deposits, gypsum, anhydrite, and halite subunits (Figure F26A, F26C, F26F).

Figure F26. Deformation structures.
6.3. Domain III: organic-rich Messinian deposits
Domain III contains a ~140 cm thick interval of black shale at its base, recovered in the final core drilled in Hole U1617B (Figure F8). The domain is characterized by organic-rich, subhorizontal deposits. Dips do not exceed 10° and average 6° (Figure F25).
7. Sediment and interstitial water geochemistry
At Site U1617, whole-round sediment samples were collected on the catwalk from 1.5 to 295.8 mbsf in Hole U1617A and 252.7–308.1 mbsf in Hole U1617B to obtain IW and sediment samples. IW from mudline at the top of cored sediments was also analyzed. IW whole rounds were collected in the Messinian evaporite deposits in Hole U1617A (Sections 35X-3 through 38X-1) and Hole U1617B (Sections 4R-4 through 10R-1). In addition to sediments from squeeze cakes, additional sediment samples were collected from the working halves of split cores in both holes. A series of shipboard analyses were conducted to determine depth profiles of IW and sediment chemistry. Headspace gas sampling was also performed at Site U1617 to measure the composition and abundance of C1–C6 hydrocarbon gases.
7.1. Interstitial water geochemistry
7.1.1. Alkalinity, pH, and salinity
IW alkalinity varies within a narrow range of 1.5–3.5 mM (Figure F27; Table T3). Alkalinity generally decreases with depth, but shows an increasing trend between 48.4 and 113.3 and between 259.8 and 298.6 mbsf. Alkalinity values are relatively low but in the same interval range as found in IW collected at Site 974 in the Tyrrhenian Sea during ODP Leg 161 (Bernasconi, 1999).

Figure F27. Alkalinity, salinity, sodium, and chloride in IW.
The IW pH value also shows little variation, ranging 7.3–7.6 throughout the depth interval in both holes (Table T3). In contrast, IW salinity varies widely from 37.5 to 73.5 (Figure F27; Table T3). Above 111.8 mbsf (Section 13H-3), salinity is approximately constant, close to the average value of 38.5 reported for Mediterranean bottom seawater (Roether et al., 1996; Tsimplis and Baker, 2000; Tanhua et al., 2013). Below this depth, the salinity increases continuously until reaching a maximum value of 73.5, most likely due to upward diffusion of brines derived from the dissolution of underlying evaporite deposits.
7.1.2. Major elements
The depth profiles of sodium (Na+) and chloride (Cl−) follow the same trend as the salinity variations (Figure F27). Indeed, a strong positive linear correlation between salinity and each of these two ions is found (R2 = 0.91 for Na+; R2 = 0.9967 for Cl−). A correlation coefficient close to 1 obtained using salinity and Cl− concentrations and salinity and Na+ concentrations reveals that these two ions can be considered as conservative elements (i.e., only affected by fluid mixing and not by chemical reactions). The sample with the highest salinity also has high Na+ and Cl− concentrations with values of 1070.2 and 1169.8 mM, respectively, and the concentrations in other samples vary from 521.3 to 633.7 mM for Na+ and from 604.6 to 727.0 mM for Cl− (Table T3). Except at 308.1 mbsf where the Na/Cl ratio reaches 0.91, this ratio is close to the value of the seawater ratio (0.86).
Another major anion, sulfate (SO42−), also shows significant changes in concentration with depth (Table T3). The value near the seafloor is 32.2 mM, which agrees with the reported values of bottom seawater in different areas of the Mediterranean Sea (Michard et al., 1974; Haese et al., 2003; Werne et al., 2004). A decreasing trend with depth, 32.20–23.5 mM, is observed above 84.9 mbsf (Section 402-U1617A-10H-3), whereas an increasing trend is present below, reaching a maximum value of 59.9 mM at 295.8 mbsf (Section 38X-1) (Figure F28). Other cations in the IW show different concentration-depth profiles (Table T3). The concentration of magnesium (Mg2+) varies from 51.3 to 60.1 mM, a limited range compared to those observed at other Expedition 402 sites. The concentration-depth profile of Mg2+ is characterized by a small decrease at 0.0–18.4 mbsf and a limited increase between 279.5 and 297.8 mbsf. These variations most probably result from carbonate diagenetic processes, notably the diagenetic formation of dolomite that is confirmed by the occurrence of this mineral within Lithostratigraphic Subunit IIIA. Potassium (K+) decreases continuously with depth, whereas calcium (Ca2+) is constant above 84.9 mbsf (Section 402-U1617A-10H-3) and then increases toward the base of the cored interval (Figure F28). The variation in Ca2+ concentration closely follows that of Na+, Cl−, SO42−, and salinity. In particular, a strong positive linear correlation (R2 = 0.96) between the concentration of Ca2+ and SO42− might indicate that the increase in concentrations of both of these elements can be attributed to dissolution of gypsum and/or anhydrite that precipitated during dry conditions. Indeed, the presence of layers composed of gypsum, anhydrite, gypsum with anhydrite, and oxide-rich anhydrite are observed in Lithostratigraphic Unit III. The decrease of K+ concentration with depth could be attributed either to ion exchange in clays or to the formation of K-rich clays (e.g., Sayles and Mangelsdorf, 1977; Kastner, 1981).

Figure F28. Major ions in IW.
The bromide (Br−) concentration shows small variations between 0.9 and 1.0 mM (Table T3). Br− concentration exhibits a very good linear correlation with Cl− concentration (R2 = 0.82), probably revealing an evaporitic origin of this element, although inputs from organic matter decomposition (Martin et al., 1993) could not be excluded.
7.1.3. Minor elements
Cations with lower concentrations include lithium (Li), boron (B), strontium (Sr), barium (Ba), silicon (Si), manganese (Mn), and iron (Fe) (Table T4). Both Li and Sr concentrations show an increasing trend to 284.5 mbsf and below this depth a slight decrease to the base of the sediment cored (Figure F29). Higher Li+ concentration in IW can be explained by an enrichment from the dissolution of late-stage evaporite minerals (Zherebtsova and Volkova, 1966). The occurrence of higher Sr content in IW could result from both the dissolution of gypsum and carbonate diagenesis because Sr and Ca2+ concentrations are not linearly correlated.

Figure F29. Lithium, boron, strontium, and manganese in IW.
Dissolved Si varies over a wide range of 134.04–251.48 µM and is most probably influenced by diagenetic processes occurring throughout the sedimentary column (Figure F30; Table T4). Concentrations of Ba, ranging 0.1–1.5 µM, show a strong linear correlation with SO42− concentrations (R2 = 0.92) indicating that diagenetic processes affecting barite influence their variations (Figure F30).

Figure F30. Silicon, iron, and barium in IW.
The concentrations of iron (Fe = Fe2+ + Fe3+) and manganese (Mn = Mn2+ + Mn4+) range from undetectable to 39.1 µM and 6.1–54.3 µM, respectively (Figures F29, F30; Table T4). The highest concentrations for iron occur at 37.4, 75.5, 94.4–113.3, 201.7, and 239.2 mbsf. Manganese shows the highest value at 9.9 mbsf. The vertical variations of both of these elements could be due to biologically mediated reactions such as organic matter mineralization using (oxy)hydroxides (Jørgensen, 2000), oxidation, and solubilization of metal sulfides (Jørgensen et al., 2004).
7.1.4. Nutrients and sulfide
Ammonium (NH4+) varies from 0.1 µM near the seafloor (Section 402-U1617A-1H-1, 145–150 cm) to 503.9 µM at 252.7 mbsf (Section 402-U1617B-2R-2) (Table T4). There is a sharp increase of NH4+ from 1.5 to 37.4 mbsf (Section 402-U1617A-5H-3). Below this depth, NH4+ generally exhibits a limited and weak increase to 193.8 mbsf and then mostly decreases to the base of the sediment cored. The concentration of phosphate (PO43−) has a maximum of 5.325 µM near the seafloor and fluctuates below this value throughout most of the cored interval (Figure F31).

Figure F31. Ammonium and phosphate in IW.
Because the ratios of alkalinity to ammonium (alkalinity/NH4+) are mostly not close to the Redfield ratio of 6.6 (Burdige, 2006), the increasing values of NH4+ are most probably due to processes unrelated to microbially mediated organic matter degradation, such as mineral diagenesis. However, near the seafloor, the slight increase in alkalinity and PO43− concentration coupled with a sharp increase in NH4+ concentration can indicate the occurrence of early organic matter diagenesis, including bacterially mediated sulfate reduction.
Sulfide concentration (ΣH2S = S2 + HS− + H2S) is low and ranges 0.6–1.6 µM. The highest value is observed near the seafloor, confirming the occurrence of sulfate reduction.
7.2. Bulk sediment geochemistry
Solid-phase sediment samples were analyzed to determine (1) the percent by weight of CaCO3; (2) the percent of total carbonates (including both calcium carbonates and other carbonate phases); (3) the percent of total organic matter; and (4) TOC, TN, and total sulfur (TS). At Site U1617, the samples analyzed included 40 squeeze cakes (33 from Hole U1617A and 7 from Hole U1617B) and an additional 36 samples (27 from Hole U1617A and 9 from Hole U1617B) selected by the core description team from sediment lithologies of interest. Headspace samples were generally collected from every core from Hole U1617A (Sections 402-U1617A-1H through 47X-CC) and Hole U1617B (Sections 402-U1617B-2R through 22R-2) except for 10 cores from which no samples were collected (nine cores for Hole U1617A: 23F, 25F, 27F, 32X, 37X, 39X, 41X, 42X and 27X; one core for Hole U1617B: 1R). Headspace samples were not collected from these cores because these cores were half advances; at least one sample for every 10 m advance was taken and analyzed following safety protocols. Source rock analysis was also performed on nine solid-phase samples (five from Hole U1617A and four from Hole U1617B).
7.2.1. Carbonates
Table T5 and Figure F32 show the results obtained for CaCO3 content. Bulk sediment CaCO3 content for Site U1617 varies from 0.4 to 75.5 wt% in Hole U1617A and from 0.3 to 59.7 wt% in Hole U1617B depending on the lithology (see Lithostratigraphy). The average CaCO3 content is 31.7 ± 14.0 wt% for Unit I, which was found only in Hole U1617A (24.6 ± 13.0 wt% for Subunit IA, 39.4 ± 8.6 wt% for Subunit IB, and 48.4 ± 4.9 wt% for Subunit IC), 49.1 ± 10.6 wt% for Unit II (48.8 ± 10.1 wt% in Hole U1617A and 46.6 ± 18.6 wt% in Hole U1617B), and 12.9 ± 17.1 wt% for Unit III (13.4 ± 21.5 wt% in Hole U1617A and 12.4 ± 12.7 wt% in Hole U1617B). In Hole U1617A, higher CaCO3 contents are generally measured in nannofossil ooze (48.5–56.8 wt% at 113.3, 179.3, 250.6, and 258.7 mbsf), nannofossil ooze associated with foraminifera (48.8–50.3 wt% at 184.2, 212.6, and 239.2 mbsf), and oxide-rich nannofossil ooze with foraminifera (53.1–59.1 wt% at 266.8–268.8 mbsf) in Subunits IB and IC and Units II and III. In Hole U1617B, high CaCO3 values only occur in the nannofossil ooze (57.8–59.7 wt% at 252.7–259.8 mbsf) of Unit II. However, the highest percentage of CaCO3 measured in Site U1617 sediments is found in Hole U1617A at 336.7 mbsf in a silt layer of Unit III. The lowest percentage of CaCO3 was measured in Hole U1617A within a black shale (0.5 wt% for Section 38X-2, 47–49 cm) and gypsum-rich mud (0.4 wt% for Sections 44X-1, 28–29 cm, and 46X-1, 91–92 cm) of Unit III, as well as in Hole U1617B within gypsum-rich mud and gypsum-rich matrix-supported, polymict conglomerate with dolomite (0.3 wt% for Section 11R-1, 87–89 cm) of Unit III. The XRD patterns show that the d(104) values of calcite vary in the range 3.037–2.990 Å, indicating contributions from two different calcite groups. A low-Mg calcite group, mostly derived from calcite in pelagic or detrital sediments, predominates between 3.037 and 3.034 Å, and a calcite group enriched in Mg, probably authigenic, predominates in from 3.014 to 2.990 Å. Two groups of dolomite are also identified: one group, characterized by d(104) values between 2.889 and 2.887 Å, is considered to be near-stoichiometric dolomite; the second group, with d(104) values between 2.905 and 2.896 Å, corresponds to dolomites in which some larger cations such as Fe2+ or Ca2+ substitute for some fraction of the Mg2+. Based on both XRD data and percentage of total carbonate content, low-Mg calcite is the dominant carbonate phase occurring in sediments between 1.5 and 278.1 mbsf in Hole U1617A as well as at 252.7, 259.8, and 279.5 mbsf in Hole U1617B. Considering the value of the total carbonate content, the percentage of low-Mg calcite ranges 18.1%–60.3% in Hole U1617A and 1.8%–21.2% in Hole U1617B. This carbonate phase originating from biogenic precipitation is associated with low amounts of authigenic carbonate phases, including high-Mg calcite (0.0%–3.3%), Fe- and/or Ca-rich dolomite (0.0%–5.1%), and stoichiometric dolomite (0.0%–4.2%). However, these authigenic carbonates are the only carbonate phases identified below 284.5 mbsf (0.0%–2.8% of high-Mg calcite, 10.0%–20.1% of Fe- and/or Ca-rich dolomite, and 0.0%–11.8% of stoichiometric dolomite) in Hole U1617A as well as at 269.86 mbsf (1.3% of high-Mg calcite and 59.9% of Fe- and/or Ca-rich dolomite), 297.6 mbsf (11.4% of Fe- and/or Ca-rich dolomite and 25.0% of stoichiometric dolomite), and 308.1 mbsf (2.5% of Fe- and/or Ca-rich dolomite and 57.1% of stoichiometric dolomite) in Hole U1617B.

Figure F32. Carbonate.
7.2.2. Total organic matter, organic carbon, nitrogen, and sulfur in the solid-phase samples
Data for total organic matter, TOC, TN, and TS in solid-phase samples are shown in Table T6 and Figure F33. The percentage of total organic matter varies from 1.0% (Section 402-U1617A-30X-3) to 19.4% (Section 38X-2) in Hole U1617A and from 1.0% (Section 402-U1617B-22R-2) to 19.1% (Section 7R-2) in Hole U1617B. The mean value is 7.1% ± 2.4% in Unit I, which was only found in Hole U1617A (8.0% ± 2.2% for Subunit IA, 6.1% ± 2.4% for Subunit IB, and 5.8% ± 0.4% for Subunit IC), 5.9% ± 1.9% for Unit II (5.6% ± 1.9% in Hole U1617A and 7.8% ± 1.5% in Hole U1617B), and 8.6 ± 5.6% for Unit III (8.8 ± 6.2% in Hole U1617A; 8.4 ± 5.2% in Hole U1617B). The highest value is measured at 296.4 mbsf (19.4%) in a black shale layer of Unit III in Hole U1617A and at 293.7 mbsf (19.1%) in a gypsum with mud layer of Unit III in Hole U1617B.

Figure F33. Total organic matter, TOC, atomic TOC/TN ratio, and TS.
TOC contents of sedimentary organic matter vary from undetectable to 5.33 wt% in Hole U1617A and from undetectable to 10.58 wt% in Hole U1617B. In Hole U1617A, they show generally little variation with a mean value of 0.32 ± 0.21 wt%, except in sapropel (49.7, 86.2, 89.3, 103.7, and 119.8 mbsf), sapropel with ash (56.8 mbsf), foraminifera-rich sapropel (96.7 mbsf), silt (295.8 and 336.7 mbsf), and organic-rich mud (331.8 mbsf). In Hole U1617B, TOC is also relatively stable with average of 0.45 ± 0.29 wt%, but higher values occur in gypsum with mud (10.58 wt% at 293.7 mbsf), gypsum (5.91 wt% at 299.4 mbsf), and black shale (2.83 wt% at 366.2 mbsf and 2.56 wt% at 366.7 mbsf).
TN values range from undetectable to 0.32 wt% with average values of 0.10 ± 0.07 wt% in Hole U1617A and 0.06 ± 0.09 wt% in Hole U1617B. Higher TN values (0.15–0.32 wt%) tend to occur in TOC-rich sediments in both holes with the exception of intervals 295.8–336.7 mbsf (Hole U1617A) and 366.2–366.7 mbsf (Hole U1617B), where TN content is low, ranging 0.01–0.06 wt%. In particular, sapropel layers in Hole U1617A and black shales in Hole U1617B identified by sedimentologists throughout the sedimentary column are characterized by higher TOC and TN levels, most likely confirming a greater algal-rich organic matter accumulation because algae are enriched in N-rich molecules (proteins).
Atomic TOC/TN ratios calculated in the analyzed sediment samples range 0.3–68.2 in Hole U1617A and 7.1–79.4 in Hole U1617B. Most of the sediments are characterized by atomic TOC/TN ratios of less than 12, indicating higher inputs of marine organic matter (Meyers, 1994). However, Figure F34 shows the relationship between TOC and TN contents, revealing the occurrence of inorganic nitrogen in sediments from Hole U1617A that could lower the atomic TOC/TN ratio and consequently cause overestimation of marine algal contribution to the sedimentary organic matter. This inorganic nitrogen (mostly composed of NH4+) could be bound to surface mineral particles, especially on the clay mineral species (Faganeli et al., 1991). However, in Hole U1617B, TN mostly consists of organic nitrogen. Atomic TOC/TN ratios of 28.4 or higher are found at several depths in Hole U1617A (267.0, 278.1, 285.3. and 295.8 mbsf) and in Hole U1617B (259.8, 269.9, 293.7, 297.9, 299.4, 308.1, 366.2, and 366.7 mbsf). The value of these ratios most likely reflects organic matter diagenesis resulting in a significant loss of N relative to primary biomass due to more labile algal-derived organic matter rather than higher inputs of terrestrial organic matter (Goldman et al., 1987; Hopkinson et al., 1997).
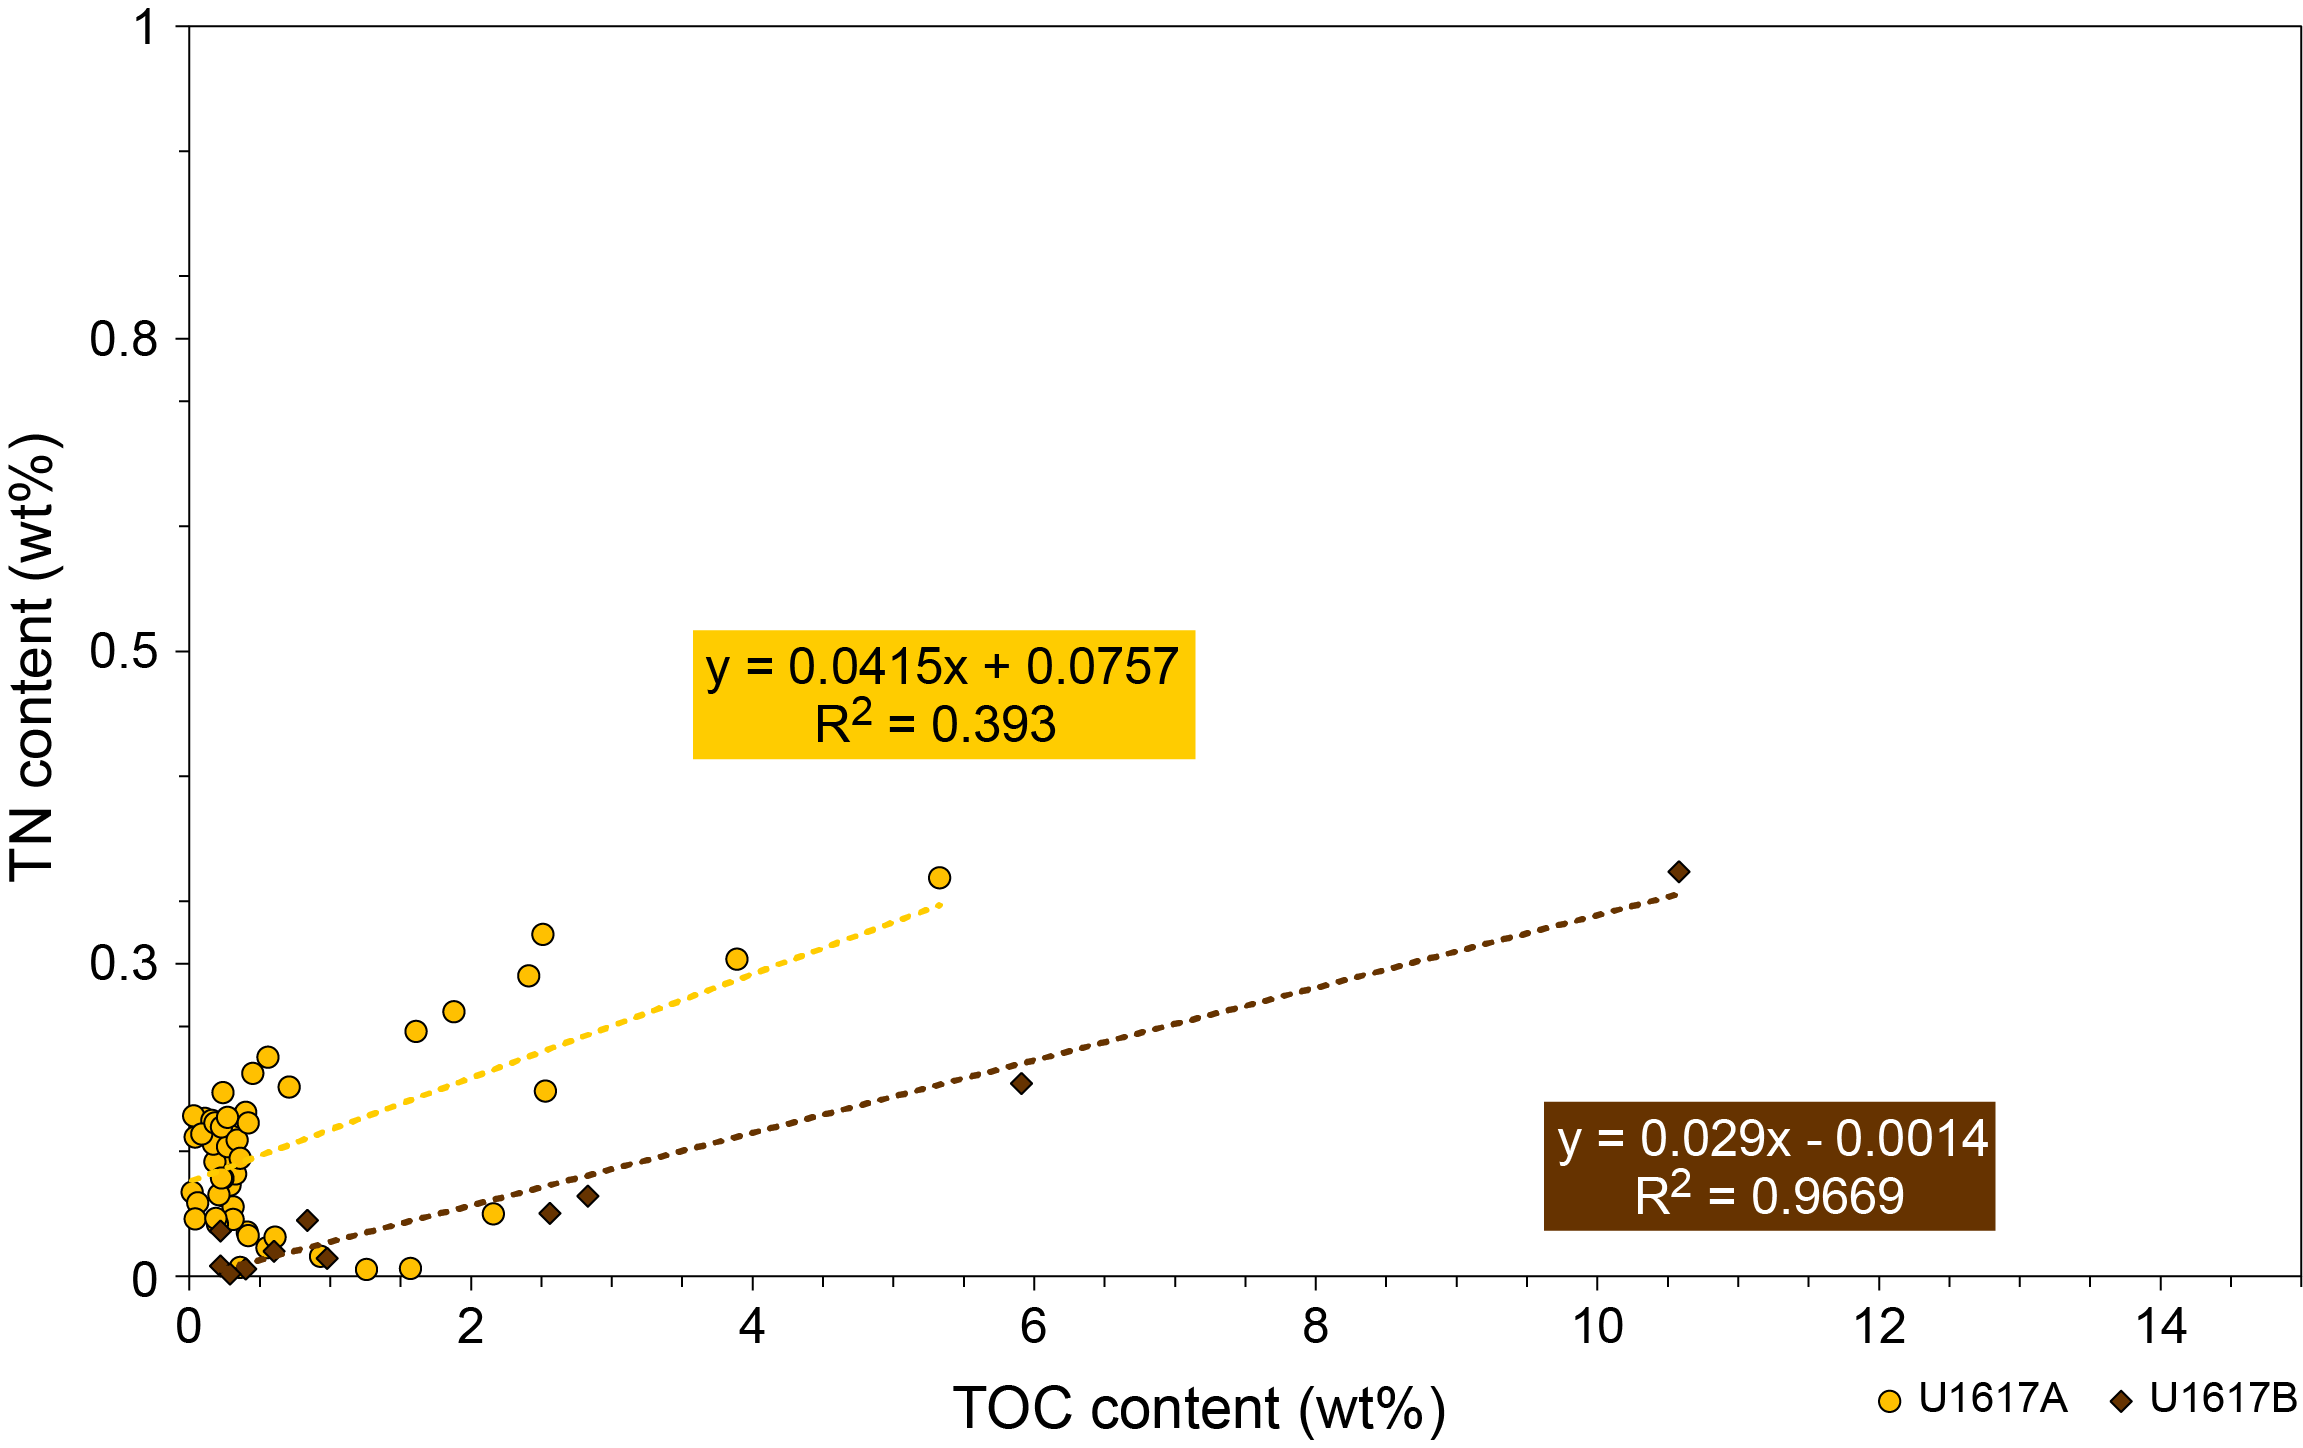
Figure F34. TOC vs. TN.
The TS content varies from undetectable to 35.8 wt% in Hole U1617A and from undetectable to 20.8 wt% in Hole U1617B. The highest values of TS content are observed at 96.7 mbsf (13.3 wt%), 322.2 mbsf (35.8 wt%), and 331.8 mbsf (12.8 wt%) in Hole U1617A. Values of TS greater than 9 wt% also occur in Hole U1617B at 293.7 mbsf (9.3 wt%), 312.7 mbsf (11.5 wt%), and 366.2–366.7 mbsf (17.6–20.8 wt%). In both holes, the TOC/TS ratio is generally close to or below the mean value found in most fine-grained marine siliciclastic sediments (TOC/TS ratios of 2.8 ± 0.8; Goldhaber and Kaplan, 1974; Berner, 1982), except in Hole U1617A at 49.7 mbsf (TOC/TS = 4.0), 91.5 mbsf (TOC/TS = 5.6), and 119.8 mbsf (TOC/TS = 7.4), indicating an excess of TS.
7.2.3. Source rock analysis
Five samples from Hole U1617A and four samples from Hole U1617B were selected for source rock analysis (Table T7). These samples were chosen based on their higher TOC content measured by elemental CHNS analyzer and/or their concentration of hydrocarbon gases. These samples have an average TOCSRA value of 3.9 ± 3.0 wt% (2.4 ± 2.0 wt% for Hole U1617A and 5.8 ± 3.2 wt% for Hole U1617B), indicating an excellent source rock qualities to generate hydrocarbon (>2 wt%) and an average of hydrogen index (HI) values of 246 mg HC/g TOC. In Hole U1617A, oxygen index (OI) values are similar at 49.66 and 267.0 mbsf (145–144 mg CO2/g TOC) and then drop to 19 mg CO2/g TOC at 336.7 mbsf. In Hole U1617B, OI values are relatively stable between 293.7 and 366.7 mbsf with a value varying from 19 and 22 mg CO2/g TOC.
Figure F35 displays the relationship between HI and OI. In Hole U1617B (297.3–299.4 mbsf), Samples 7R-1, 73–74 cm, and 8R-3, 13–14 cm, are characterized by high HI (628–666 mg HC/g TOC) and low OI (19–21 mg CO2/g TOC), corresponding to the chemical composition of Type I kerogen (originating from algal organic matter in lacustrine environments) and/or Type IIS kerogen (sulfur-rich Type II kerogen originating from marine algal organic matter) and therefore to oil-prone source rocks. Two other samples from Hole U1617B (22R-1, 70–71 cm, and 22R-2, 7–8 cm) have lower HI (273–319 mg HC/g TOC) and similar OI (19–22 mg CO2/g TOC) than the two previous samples, revealing that their chemical composition is close to Type II kerogen (deriving from marine algal organic matter) and that these samples correspond to oil-prone source rocks. Sample 402-U1617A-38X-1, 90–95 cm, which shows lower HI (215 mg HC/g TOC) and higher OI (48 mg CO2/g TOC) than previous samples, is intermediate between Type II and Type III (derived from terrestrial organic matter) kerogens and corresponds to a mixed oil/gas-prone source rocks. Samples 46X-1, 91–92 cm, and 47X-CC, 24–25 cm, are characterized by lower HI (48–67 mg HC/g TOC) than previous samples and OI varying from 19 to 24 mg CO2/g TOC, indicating that their chemical composition is close to Type III kerogen (derived from terrestrial organic matter) and that these samples correspond to gas-prone source rocks. For example, two samples collected from Hole U1617A (6H-5, 118–119 cm, and 34X-3, 10–11 cm) are characterized by a very low HI (0–1 mg HC/g TOC) and are located in Type IV kerogen. This type of kerogen is a product of severe alteration and/or oxidation of organic matter in the depositional environment and is essentially inert with no hydrocarbon-generating potential (Tissot and Welte, 1984).

Figure F35. HI/OI plot.
7.2.4. Major, minor, and trace element content of sediments
Sediments collected at Site U1617 in the form of IW squeeze cakes, along with their adjacent intervals in the same section halves, were analyzed using portable X-ray fluorescence spectrometry (pXRF) and ICP-AES. In total, 32 IW squeeze cakes and their adjacent section halves were analyzed from Hole U1617A, and 7 were analyzed from Hole U1617B. The results of the pXRF analyses, in the form of corrected and raw data, are summarized in Tables T8 and T9. Variations with depth for selected elements and oxides are plotted in Figure F36.

Figure F36. pXRF elemental concentration.
In Hole U1617A, from 0 to ~50 mbsf, Al2O3, CaO, and Ni contents increase steadily as the recovered nannofossil oozes become richer in volcanic ash layers. Nannofossil/foraminifera-rich sediment layers between 50 and 260 mbsf show only little variation in chemical composition. Below ~275 mbsf, sediments transition to organic-rich and often oxide-rich silts, with a sharp increase in Fe and Rb contents and an equally sharp decrease in CaO and Sr contents (Figure F36). The Al2O3 content also decreases between ~275 and 300 mbsf, whereas Cu and Ni show higher concentrations.
As drilling continued in Hole U1617B, beginning at ~250 mbsf we saw the continuation of the trends described at the bottom of the recovered material from Hole U1617A to ~280 mbsf. From ~280 to ~310 mbsf, the abundances of Fe, Cu, Ni, and Rb all increase, whereas MnO, CaO, and Sr all decrease toward the bottom of the hole.
Three and four intervals were selected for ICP-AES analysis from Holes U1617A and U1617B, respectively. The results of these analyses are presented with loss on ignition (LOI) values in Table T10. The physical properties laboratory group identified an interval in Section 402-U1617A-34X-4 as having anomalous physical properties relative to surrounding sediment (see Physical properties). The ICP-AES data of interval 34X-4, 105–106 cm, revealed the presence of Fe2O3t at a high concentration of 31.4 wt% (Table T10). Further scanning electron microscopy–energy dispersive spectroscopy (SEM-EDS) chemical imaging of a thin section (34X-4, 103–105 cm) confirmed an elemental correlation between Fe and S, suggesting the presence of sulfide phases therein (Figure F37).

Figure F37. Black layer with anomalous physical properties.
7.3. Headspace gas sample analysis
Gas sampling and analysis were performed at Site U1617 by taking one headspace gas sample per core (Cores 402-U1617A-1H through 47X and 402-U1617B-2R through 22R), which was analyzed to monitor C1–C6 hydrocarbons in accordance with the standard safety protocol during drilling (Pimmel and Claypool, 2001). In total, 61 headspace gas samples, including 40 samples for Hole U1617A and 21 samples for Hole U1617B, were analyzed to determine hydrocarbon concentrations in parts per million by volume (Figure F38; Table T11). Methane (CH4) was the only hydrocarbon gas detected between 1.5 mbsf (Core 402-U1617A-1H) and 332.4 mbsf (Core 402-U1617A-47X) in Hole U1617A and between 252.7 mbsf (Core 402-U1617B-2R) and 362.1 mbsf (Core 402-U1617B-22R) in Hole U1617B. CH4 was negligible with a mean value of 3.1 ± 2.8 ppmv, except at the deepest depth in Hole U1617B (362.1 mbsf; Section 402-U1617B-21R-2; 79.8 ppmv; 367.4 mbsf; Section 402-U1617B-22R-2; 155.1 ppmv). Hydrocarbon gases other than methane were also present below 336.4 mbsf in Hole U1617A and 367.4 mbsf in Hole U1617B. These gases include ethane (0.9 ppmv) and ethene (0.8 ppmv) for Hole U1617A, and ethane (14.0 ppmv) and propane (7.6 ppmv) for Hole U1617B. The C1/C2 ratio is characterized by values of 11.3 at 336.4 mbsf in Hole U1617A and 11.1 at 367.4 mbsf in Hole U1617B. The C1/C+ ratio is 7.2 at 367.4 mbsf in Hole U1617B. In Hole U1617B, we observed an anomalous C1/C2 relationship with temperature (~60°C), and this observation resulted in the termination of coring in Hole U1617B (Figure F39).

Figure F38. Methane concentrations.

Figure F39. C1/C2 ratio.
8. Physical properties
Site U1617 sampled a complete sediment succession, reaching the Messinian on the Campania Terrace in two holes. Hole U1617A was drilled with the APC/XCB system and had excellent overall core recovery (89%), providing a nearly continuous sedimentary sequence for physical properties measurements. Hole U1617B was drilled with the RCB system without recovery for the uppermost 250 m and then recovered the Messinian interval before drilling was terminated due to the occurrence of hydrocarbon-rich shales.
We collected a standard set of measurements on whole-round sections including GRA bulk density, MS, and P-wave velocity (VP) with the Whole-Round Multisensor Logger (WRMSL), and NGR. We also obtained X-ray images of the split core sections. After the core was split, we performed discrete measurements of VP in the X-direction (see Physical properties in the Expedition 402 methods chapter [Malinverno et al., 2025]) with the Gantry system and measured thermal conductivity and collected samples for MAD analysis (Table T12).
The measured physical properties of the sediments recovered from Site U1617 show distinct variations that correlate with the three defined lithostratigraphic units (Figures F40, F41, F42). Because there is no formal stratigraphic correlation between the two holes, we describe the first two units (Figure F40) and the transition between post-Messinian Unit II to Messinian Unit III (Figure F41) based on results from Hole U1617A; the measurements and description of Unit III are from Hole U1617B cores.

Figure F40. Physical properties, Hole U1617A.

Figure F41. Physical properties (402-U1617A-33X-1 through 47X-CC).

Figure F42. Physical properties, Hole U1617B.
The shallowest sediments of Unit I display elevated and fluctuating NGR and MS values corresponding to organic-rich sapropel and tephra layers intermixed with nannofossil ooze. Throughout Unit I, MS and porosity generally decrease with increasing depth and VP, density, and thermal conductivity gradually increase. Unit II, consisting mostly of nannofossil ooze, marks a transition to more constant physical properties with depth. Finally, Unit III contains the Messinian interval and shows more variation in all physical properties. Spikes in NGR and MS; a steep velocity increase with increasing depth with bimodal values in interlayered fast evaporites and slow pelagic mud; and variable bulk density, porosity, and thermal conductivity are found in Unit III, reflecting the lithologic heterogeneity of the Messinian deposits. Table T13 summarizes the physical properties statistics for each lithostratigraphic unit based on Holes U1617A (Units I and II) and U1617B (Unit III).
8.1. Lithostratigraphic Unit I
8.1.1. Lithostratigraphic Subunit IA
Lithostratigraphic Subunit IA includes the interval from the seafloor through Section 402-U1617A-11H-CC (0–99.45 m CSF-B). Sediment porosity in this interval varies from 80% to 54% based on 21 MAD samples, and bulk density ranges 1.35–1.75 g/cm3. The average VP in this interval is 1538 (WRMSL) and 1515 m/s (Gantry). NGR and MS both show highly oscillatory patterns, with NGR increasing slightly and MS decreasing with increasing depth, respectively (Figure F40). Locally elevated NGR values correspond to organic-rich sapropel layers, and elevated MS values correspond to tephra layers. A total of 11 thermal conductivity measurements yielded an average of 1.099 W/(m∙K).
8.1.2. Lithostratigraphic Subunit IB
Lithostratigraphic Subunit IB extends from Section 402-U1617A-12H-1 through 19H-CC (99.45–170.65 m CSF-B). Bulk density in this interval varies from 1.766 to 1.899 g/cm3 based on 16 MAD samples, and porosity ranges 56%–48%. This interval has an average VP of 1615 (WRMSL) and 1600 m/s (Gantry). Thermal conductivity was measured on eight samples from this interval and averages 1.308 W/(m∙K). MS slightly decreases with depth and shows several high peak values. In contrast, NGR remains relatively constant with an average of ~34 counts/s. All detailed values are listed in Table T13.
8.1.3. Lithostratigraphic Subunit IC
Lithostratigraphic Subunit IC extends from Section 402-U1617A-20H-1 through 24F-CC (170.65–195.95 m CSF-B). Bulk density in this interval varies from 1.50 to 1.93 g/cm3 based on eight MAD samples, and porosity ranges 71%–48%. The average VP is 1646 m/s based on 26 discrete Gantry measurements and 1657 m/s based on WRMSL. MS varies from ~25–30 to ~100 IU, associated with several spikes similar to those observed in Subunit IA and likely a function of the tephra content (Figure F40). NGR was nearly constant at ~33 counts/s, as was thermal conductivity from 1.213 to 1.311 W/(m∙K) (Figure F41).
8.2. Lithostratigraphic Unit II
Lithostratigraphic Unit II extends from Section 402-U1617A-25F-1 through 34X-4 (195.95–269 m CSF-B). This unit consists predominantly of nannofossil ooze and shows mostly constant physical properties, except for a slight local deflection around ~220 m CSF-B where recovery was poor. Trends immediately above and below this missing interval show lower NGR, MS, VP, and density, as well as a local increase in thermal conductivity. No clear changes in lithology (other than a slight increase in foraminifera content) were found to explain this local deflection in physical properties. A total of 14 MAD samples revealed an average density of 1.895 g/cm3 and a porosity of 50%. Average VP values of 1653 (Gantry) and 1680 m/s (WRMSL) were measured, consistent with the relatively slow pelagic mud. MS averages 21 IU, NGR averages 29 counts/s, and thermal conductivity (nine measurements) averages 1.321 W/(m∙K).
8.3. Lithostratigraphic Unit III: Messinian interval
Lithostratigraphic Unit III corresponds to the Messinian sedimentary interval and extends from Section 402-U1617A-34X-4 to the base of Hole U1617A (269–340 m CSF-B) and from Section 402-U1617B-4R-1 to the base of Hole U1617B (262.8–370.4 m CSF-B). Lithologies are dominantly oxide- and gypsum-rich mud with interbedded nodular, laminated, and massive evaporite deposits of gypsum and anhydrite. NGR is highly oscillatory (Figures F41, F42) with elevated values corresponding to several organic-rich intervals. MS is relatively constant (~25 IU) in the upper half of the unit, but the lower half is more variable with numerous peaks up to 100 IU. VP shows an increasing trend that is steeper compared to the overlying lithostratigraphic units. Specifically, we found a bimodal distribution of values between fast evaporite layers (>4000 m/s) and slow pelagic mud intervals (<2000 m/s). Similar to previous holes, incomplete filling of the core liners limited the quality of the WRMSL data, and only the discrete Gantry measurements provided reliable velocity data. Cores recovered in Hole U1617B, only ~20 m away from Hole U1617A, allowed us to clarify details of the stratigraphy of Messinian deposits and identify three subunits. A total of 18 MAD samples were analyzed from Lithostratigraphic Unit III in Hole U1617A and 32 from Hole U1617B, yielding average densities of 2.11 and 2.265 g/cm3, respectively, and average porosities that change from 40% to 29% from Hole U1617A to Hole U1617B. This difference in densities reflects the fact that Hole U1617B recovered a deeper interval with many denser and less porous evaporitic rocks (Figures F41, F42; Table T13).
Within the upper part of the Messinian unit in Section 402-U1617A-34X-4 (269–269.2 m CSF-B), a black layer overlain by oxidized rich mud with foraminifera shows anomalous physical properties compared to the surrounding sediments. MAD analysis of a sample from this black layer returned a high bulk density of 2.337 g/cm3, a very high grain density of 3.405 g/cm3, and a rather low porosity of 45%. pXRF analysis reveals a high concentration of iron, and elemental mapping with SEM-EDS shows co-located iron and sulfur (Figure F37).
8.3.1. Lithostratigraphic Subunit IIIA
Lithostratigraphic Subunit IIIA extends from Section 402-U1617B-4R-1 through 13R-2 (262.8–323.27 m CSF-B) and consists primarily of oxide-, dolomite-, gypsum-, and organic-rich mud. A total of 21 MAD samples were collected from this interval, showing density variations from 1.725 g/cm3 in a mudstone from Section 11R-3 to 2.836 g/cm3 in an anhydrite nodule from Section 12R-4 (Figure F42). The porosity in this interval varies from 59% to 7% with the extreme values recorded in the samples mentioned above. The average density is 2.11 g/cm3, and the average porosity is 37%. The upper part of Subunit IIIA (Cores 4R and 5R) has constant trends in MS (around 25 IU) and VP (average = 1720 m/s based on 16 Gantry measurements). Starting from Core 6R, the MS average decreases to ~15 IU with several spikes up to 100 IU and VP develops a bimodal distribution with low values of ~1700 m/s in mud intervals and ~4000 m/s values corresponding to gypsum-rich layers. NGR is also widely variable in this interval and ranges 0–72 counts/s, whereas thermal conductivity remains stable around 1 W/(m∙K) throughout the entire subunit, except for a sudden increase at the base that reaches 6.605 W/(m∙K).
8.3.2. Lithostratigraphic Subunit IIIB
Lithostratigraphic Subunit IIIB extends from Section 402-U1617B-13R-2 through 18R-1 (323.27–346.54 m CSF-B) and consists of anhydrite with some gypsum. The average density of 2.632 g/cm3 was based on nine MAD samples collected from this interval, and the average porosity was 16% (Figure F42). NGR and MS are much lower in this interval compared to Subunit IIIA (~9.5 counts/s and ~68.77 IU, respectively) with a few spikes up to 40.7 counts/s and 5979 IU, respectively. The average VP is 3943 m/s based on 23 Gantry measurements and ranges from 1822 m/s in muddy intervals to 4924 m/s in anhydrite nodules. Thermal conductivity increases compared to Subunit IIIA and ranges 3.164–6.344 W/(m∙K) based on five measurements.
8.3.3. Lithostratigraphic Subunit IIIC
Lithostratigraphic Subunit IIIC extends from Section 402-U1617B-18R-2 to the bottom of the hole (346.54–370.4 m CSF-B) and is composed primarily of halite with a black shale interval at the base. The density does not vary much in this subunit, despite the dramatically different lithologies (average value = 2.16 g/cm3 based on three MAD samples), and porosity varies from 0% in halite to 41% in shale (Figure F42). NGR and MS are the lowest in this subunit with values ranging 0.07–34.13 counts/s and 0.06–7.36 IU, respectively. VP in halite was measured on four samples and averages 4019 m/s; a value of 5124 m/s (average of three measurements) was recorded over an anhydrite-rich section in Core 22R, and the average of two measurements in the black shale was 1944 m/s. Thermal conductivity (three measurements) decreases from 6.344 W/(m∙K) in halite to 1.128 W/(m∙K) in black shale.
8.4. Core-seismic integration
A depth-time relationship was established from VP measurements of recovered cores in Holes U1617A (Figures F40, F41) and U1617B (Figure F42). Borehole obstructions encountered during logging operations prevented the acquisition of sonic log data in Hole U1617A. For Hole U1617B, sonic log data were collected over a 40 m interval in the Messinian (see Downhole measurements). The monopole sonic waveforms were noisy but adequate to obtain VP in the logged interval, whereas the dipole waveforms were too incoherent to yield S-wave velocity (VS) information. VP values from the logged section agreed closely with VP measured on core sections using the Gantry system. A preliminary depth-time conversion was constructed from VP core data only because the sonic data needed further evaluation after the expedition.
The depth-time conversion allows us to estimate the position of recovered cores in two-way traveltime (TWT) on the MEDOC 6 seismic reflection line (Figure F43) (Ranero and Sallarès, 2017). VP data for Units I and II were reliable with a generally increasing trend with increasing depth and few erroneous fluctuations. Unit III has a bimodal velocity distribution with discrete Gantry measurements yielding very fast VP values (>4000 m/s) in gypsum, anhydrite, and halite and slower intervals (>2000 m/s) in organic-rich mudstone layers. Thus, a representative average velocity for the low-frequency seismic reflection data will lie somewhere in between the fast and slow values. As for previous sites, the velocity data were smoothed with a Sovitzky-Golay filter, which captures small-scale fluctuations and primary trends while ignoring outliers (Figure F43, green line), and for comparison a third-degree polynomial was fit to the velocity-depth data to represent an ultrasmooth end-member (Figure F43, red line). Both velocity-depth functions give very similar depth-to-time estimates for core positions throughout the hole.

Figure F43. VP and plot of Site U1617 core tops.
The TWT depths of the upper cores, derived from the depth-time relationship, are plotted on the seismic reflection image of MEDOC 6 as green stars in Figure F43. The top of the Messinian, identified in Core 402-U1617A-34R (Figure F41) and Section 402-U1617B-4R-1 (Figure F43, white star), corresponds to the center of a large-amplitude positive polarity reflector (blue dashed horizon). The base of the Messinian corresponds to the center of a large-amplitude reverse polarity horizon (cyan dashed horizon), due to a velocity inversion at the boundary between fast halite layers overlying the slower pre-Messinian black shales below. Combining seismic reflection and core data, Unit I (Cores 402-U1617A-1H through 25F; about 200 m CSF-B) corresponds to subhorizontal stratified sediments, whereas the sediments below are more chaotic, folded, and faulted (Figure F43). Corresponding to this change, a biostratigraphic hiatus in the upper Gelasian–lower Calabrian periods was identified (see Biostratigraphy). The seismic image shows slightly deformed sediments with turtle structures (Gaullier and Vendeville, 2005) that resemble concave-down arch geometries below Unit I. The abundant faults and fractures and greater bed dip angles identified by the structural geology team in Cores 26F–34X correspond to this deformed zone on the seismic reflection data, where bedding dip increases up to 30° (Core 29X) and up to 50° at the top of the Messinian (Section 34X-4).
9. Downhole measurements
Downhole measurements at Site U1617 consisted of in situ sediment temperatures acquired with the APCT-3 tool and limited downhole geophysical measurements.
The downhole geophysical measurements operations began after the completion of APC/XCB coring in Hole U1617A to 339.9 mbsf. The hole was swept with high-viscosity mud to clear debris (see Operations), and the pipe was set at 74.6 mbsf. A first pass was made with the triple combo tool string, which included the logging equipment head-tension and mud temperature (LEH-PT) for the temperature and electrical resistivity of the borehole fluid; the Enhanced Digital Telemetry Cartridge (EDTC) for total natural gamma ray; the Hostile Environment Natural Gamma Ray Sonde (HNGS) tool recording total spectral gamma ray (HSGR) data in American Petroleum Institute gamma radiation units (gAPI); the Hostile Environment Litho-Density Sonde (HLDS) for bulk density, photoelectric effect, and a one-arm caliper; the High-Resolution Laterolog Array (HRLA); and the Magnetic Susceptibility Sonde (MSS). During the down log, an obstruction was encountered at 135.4 mbsf (~200 m above the bottom of the hole) and the tool was unable to pass. The interval from 74.6 to 135.4 mbsf was logged during both the down and up pass, recording natural gamma ray, electrical resistivity, MS, and bulk density data in the open hole. Natural gamma ray data were also recorded through pipe up to the seafloor.
After lowering the bottom of the pipe to 151.7 mbsf, which is below the obstruction encountered in the first run, we attempted a second run with the same tool string. After working through several obstructions, the tool could not advance deeper than 170.4 mbsf. This depth corresponds to an increase in the bedding dips and the number of faults in the cores (Figure F24). Although natural gamma ray data were recorded through the pipe during the down and up passes, only the MSS measured data in the open hole.
Downhole measurements were also undertaken in Hole U1617B after coring through the evaporitic deposits of the Messinian salinity crisis. The base of the drill pipe was set at 279.9 mbsf after dropping the RCB bit in the bottom of the hole. The first downhole pass was made with the same triple combo tool string as in Hole U1617A. During the down log, an obstruction was encountered at 326.4 mbsf (44 m above the bottom of the hole) and the tool was unable to pass. The section from 273 to 326.4 mbsf was logged during both the down and up pass, recording natural gamma ray, electrical resistivity, MS, and bulk density data in the open hole. The HLDS tool was run with the caliper closed because of the short logging interval. Natural gamma ray data were also recorded through the drill pipe up to the seafloor.
The second logging run in Hole U1617B included the DSI and the HNGS. The FMS was not included in the tool string because we did not have a caliper measurement of hole diameter. The tool string was stopped by the same bridge as the triple combo tool string. It provided sonic data in Hole U1617B from 279.9 to 318 mbsf through gypsum and consolidated mud deposits.
For the third geophysical run into Hole U1617B, the base of the drill pipe was set at 336.8 mbsf. For this run, a shortened triple combo tool string was used, including the LEH-PT for the temperature and electrical resistivity of the borehole fluid, the EDTC for total natural gamma ray, the HNGS, the HRLA, and the MSS. The HLDS was not included in the tool string. The tool string was stopped by fill near the bottom of the hole. After Logging Run 3 in Hole U1617B, no further run was attempted because the hole size was expected to be large, especially through the halite deposits below 347 mbsf.
9.1. Downhole temperature measurements and heat flow
9.1.1. Downhole temperature measurements
The APCT-3 tool was deployed three times in the upper part of Hole U1617A to measure in situ sediment temperatures. Measurements were successfully made on Cores 4H, 7H, and 10H at 33.0, 61.5, and 90.0 mbsf, yielding equilibrium temperatures of 17.79°C, 21.47°C and 24.83°C, respectively. These temperatures are consistent with a seafloor equilibrium temperature of 13.55°C recorded by the APCT-3 tool above the seafloor on the second run. The shipboard correction factor was applied to all measurements. These data provide a thermal gradient of 12.58°C/100 m (Figure F44; Table T14). Borehole fluid temperature measurements were also taken during the downhole geophysical operations in Hole U1617A using the LEH-PT Schlumberger cable head. The down log pass measured a seafloor temperature of 13.40°C.

Figure F44. Downhole temperatures.
9.1.2. Heat flow
A heat flow of 136 mW/m2 is obtained for Site U1617 from a thermal gradient of 12.58°C/100 m combined with an average thermal conductivity of 1.085 W/(m·K) measured on the uppermost 90 m of recovered sediments in Hole U1617A (see Physical properties). This result compares favorably with those obtained from near-seafloor measurements (Della Vedova et al., 2001) and at ODP Leg 107 Site 652 (160 mW/m2; Kastens, Mascle, Auroux et al., 1987) and ODP Leg 161 Site 974 (157 mW/m2; Comas, Zahn, Klaus et al., 1996) and at Site U1613 on the Cornaglia Terrace.
9.2. Borehole geophysics
9.2.1. Borehole geophysics in Hole U1617A
The MSS was located at the base of the tool string, and as a result this tool recorded the most data in Hole U1617A. The first run recorded 60.8 m of MS data (Figure F45). An additional 22.0 m of MS data were obtained during the second run, yielding a total of 84.1 m. Spikes in downhole MS values are well aligned with peaks measured on the recovered core with the WRMSL and Section Half Multisensor Logger (SHMSL). However, the downhole data values are generally lower than those measured on recovered cores, probably due to the expected large hole diameter.

Figure F45. Downhole logging and physical properties measurements, Hole U1617A.
The natural gamma data were recorded from the seafloor to 140 mbsf, mostly through the pipe except for a 32.7 m interval acquired during the first run. In the open hole section (74.6–111 mbsf), the thorium and uranium concentrations from HSGR agree with the NGR measurements on recovered core sections. In contrast, the potassium curve from the HSGR data is lower than that from NGR measured on the recovered core (Figure F45). Thorium and uranium produce significantly higher energy natural gamma ray than potassium (Ellis and Singer, 2007); therefore, the mismatch between core and downhole potassium data is probably related to the large hole diameter and the greater attenuation of the potassium signal relative to thorium and uranium. However, the downhole data show more variability in the short open hole interval than the core data (Figure F45).
Good quality electrical resistivity data were recorded in the open hole over a short interval (74.6–124 mbsf) during the first run of the triple combo tool string. For example, the Lithostratigraphic Subunit IA/IB boundary is marked by a sharp increase in electrical resistivity with increasing depth. However, the large offset in signal intensity between the shallow (R2) and deep (R5) resistivity curves provides another indication of a large hole diameter at this depth. Some spikes in electrical resistivity correspond to higher downhole MS values as well as peaks measured on the core using the WRMSL and SHMSL.
The bulk density measurements provided unreasonably low values and were not consistent with the GRA bulk density made on the WRMSL or MAD measurements made on discrete samples. These data are considered unreliable, mainly because the caliper arm in the tool was kept closed during both runs.
Overall, most of the downhole geophysical data recorded in Hole U1617A can be considered as qualitative in the absence of hole size data.
9.2.2. Borehole geophysics in Hole U1617B
The MSS was located at the base of the triple combo tool string, and as a result it recorded the most data in Hole U1617B. During the first run, 62.1 m of MS data were obtained (Figure F46), mostly through gypsum-rich and clay layers and generally agree well with core measurements. Another ~25 m of MS data were obtained during the third logging run for a total of 87.1 m. The MS log is distinctly high in the halite interval and determines a total thickness of 13 m for these deposits with 5 m of pure halite at the top.

Figure F46. Downhole logging and physical properties measurements, Hole U1617B.
The natural gamma data were recorded from the seafloor to 302 mbsf, mostly through the pipe except for a 26 m interval acquired in the open hole during the first run. In the open hole section (~336–346 mbsf), the in situ natural gamma ray data can be compared to those measured on core. However, the core recovery is extremely low (less than 10%) in this interval (Figure F46). The few high uranium, thorium, and potassium values measured on the core are averaged in downhole data but still appear as local maxima. In the BHA and drill pipe above, the natural gamma data are attenuated, especially the potassium.
Electrical resistivity data were recorded in the open hole during the first run over a 36 m interval (279.9–314 mbsf), mostly through gypsum and clay layers. Another 18 m of electrical resistivity data were obtained during the third run for a total of 54 m, measuring electrical resistivity values more than 10,000 Ωm in the pure halite deposits, with 5 m of pure halite identified on the basis of these elevated values at 351 mbsf (Figure F46).
As with Hole U1617A, the bulk density data recorded with the HLDS are unreliable because the caliper arm was not opened.
During the first run in Hole U1617B, DSI data were recorded in the open hole from the base of the BHA to 317 mbsf through mostly interlayered gypsum and clay. Waveforms from both shear-wave dipoles were very noisy and not coherent enough to yield a reliable VS profile. The monopole compressional waves were generally coherent, and the extracted VP profile agrees well with Gantry measurements on the recovered cores (see Physical properties). VP is strongly correlated with the resistivity log, and wave speeds are ~2000 m/s within clay-rich intervals and ~4000 m/s within gypsum-rich zones (Figure F46).
10. Microbiology
10.1. Sediment
Hole U1617A was drilled to a total depth of 339.9 mbsf. Microbiological analyses included dissolved oxygen measurements in sediment IW and contamination testing using a perfluorodecalin (PFD) tracer pumped with the drilling fluid. Whole-round and syringe plug samples were collected for shore-based molecular biology and culture studies. Microbiological samples were not collected in Hole U1617B because the evaporitic facies was not a primary objective of the planned microbiological research during this expedition.
10.1.1. Oxygen profiles
Oxygen is the most energetically favorable terminal electron acceptor used in microbial degradation of organic matter in the environment. Its concentration in Hole U1617A IW was measured immediately after core recovery, starting with Core 1H. Cores 1H and 2H were measured at high resolution from 0 to 6.49 mbsf and showed relatively high oxygen concentrations that decreased with depth. Low concentrations were detected downcore, with a minimum value of 0.1 µmol/L at 6.49 mbsf (Figure F47; Table T15). Readings remained at very low concentrations (<3 µmol/L) down to 90 mbsf, where probe insertion became impossible because of sediment compaction.

Figure F47. Oxygen concentration profile.
10.1.2. Microbiological contamination testing
Three samples were collected from each core for analysis of the microbial contamination tracer (PFD): drilling fluid from the top of the core, a plug of sediment from the core exterior to verify delivery of the tracer to the core, and a plug of sediment from the core interior adjacent to the microbiological samples to evaluate extent of contamination. All samples were stored in glass headspace vials until analysis using a gas chromatograph (GC). A total of 30 samples of drilling fluid, both internal and external, were collected on the catwalk. The median PFD concentration of the drilling fluid samples is 2.9 ng/g. Concentrations of samples taken from the interior and exterior of the core are significantly lower than in the drilling fluid. PFD detected in core exterior samples (median concentration = 0.003 ng/g) indicates successful delivery of the tracer. Detection in core interior samples was minimal (median = 0 ng/g) (Figure F48; Table T16). Samples from cores collected with the APC/XCB system are known to have a lower risk of contamination relative to other coring techniques (Coggon et al., 2024; Sylvan et al., 2021).

Figure F48. PFD tracer concentrations.
10.1.3. Microbiological sampling
10.1.3.1. Microbial community
Sediment samples were collected in Hole U1617A for analysis of the resident microbial communities. For this analysis, 5 cm long whole rounds were collected every 20 m for metagenomic analysis and a 10 mL plug was extracted from the center of each core with a sterile syringe for 16S rRNA gene amplification and sequencing. These samples were bagged and frozen at −86°C immediately after collection for onshore analysis.
10.1.3.2. Microbial experiments
An additional whole-round sample was collected on the catwalk from Sections 402-U1617A-3H-5, 7H-5, 9H-5, and 12H-7 to perform microbial experiments on samples from possible geochemical transition zones where there may be important changes in sediment and IW composition affecting the distribution and availability of nutrients and elements essential for life. One whole-round sample was selected for processing in the anaerobic chamber and maintained at 11°C.
Samples from Sections 402-U1617A-3H-5 and 7H-5 were used to perform viral production, prophage induction, and enrichment experiments. To detect viral activity, the sample was incubated in a 100 mL serum vial under dark conditions while maintaining an anaerobic headspace. Incubations were subsampled at t = 0, t = 4, t = 8, t = 12, and t = 24 h. For each subsample, 1 mL of sample was collected in triplicate, fixed with 54 µL of 37% formaldehyde, and stored at −86°C. Incubations were performed in the anaerobic chamber, and the subsampling was performed in the biosafety cabinet (clean air) without opening the incubation bottles.
In addition, samples from Sections 402-U1617A-9H-5 and 12H-7 were used to prepare enrichment cultures using two anaerobic culture media (MMJHS and MJYPGS) (see Microbiology in the Expedition 402 methods chapter [Malinverno et al., 2025]), which were then stored in the dark at room temperature. The sediment was diluted in synthetic anaerobic seawater to facilitate transfer of the sediment to the vials.
10.1.3.3. Viral counts
Plug samples (1 cm3) were taken from each core (9.5 m) and then fixed with 4 mL of a solution of formaldehyde in phosphate-buffered saline (100 mM) and stored at 4°C for onshore analysis.
References
Bernasconi, S.M., 1999. Interstitial water chemistry in the western Mediterranean: results from Leg 161. In Zahn, R., Comas, M.C., and Klaus, A. (Eds.), Proceedings of the Ocean Drilling Program, Scientific Results. 161: College Station, TX (Ocean Drilling Program). http://doi.org/10.2973/odp.proc.sr.161.228.1999
Berner, R.A., 1982. Burial of organic carbon and pyrite sulfur in the modern ocean: its geochemical and environmental significance. American Journal of Science, 282(4):451–473. http://doi.org/10.2475/ajs.282.4.451
Burdige, D.J., 2006. Geochemistry of Marine Sediments: Princeton, NJ (Princeton University Press). http://digitalcommons.odu.edu/oeas_books/1
Caratori Tontini, F., Stefanelli, P., Giori, I., Faggioni, O., Carmisciano, C., 2004. The revised aeromagnetic anomaly map of Italy. Annals of Geophysics, 47(5). http://doi.org/10.4401/ag-3358
Cita, M.B., Santambrogio, S., Melillo, B., and Rogate, F., 1990. Messinian paleoenvironments; new evidence from the Tyrrhenian Sea (ODP Leg 107). In Kastens, K.A., Mascle, J., et al., Proceedings of the Ocean Drilling Program, Scientific Results. 107: College Station, TX (Ocean Drilling Program), 211–227. http://doi.org/10.2973/odp.proc.sr.107.161.1990
Coggon, R.M., Teagle, D.A.H., Sylvan, J.B., Reece, J., Estes, E.R., Williams, T.J., Christeson, G.L., Aizawa, M., Albers, E., Amadori, C., Belgrano, T.M., Borrelli, C., Bridges, J.D., Carter, E.J., D'Angelo, T., Dinarès-Turell, J., Doi, N., Estep, J.D., Evans, A., Gilhooly, W.P., III, Grant, L.C.J., Guérin, G.M., Harris, M., Hojnacki, V.M., Hong, G., Jin, X., Jonnalagadda, M., Kaplan, M.R., Kempton, P.D., Kuwano, D., Labonte, J.M., Lam, A.R., Latas, M., Lowery, C.M., Lu, W., McIntyre, A., Moal-Darrigade, P., Pekar, S.F., Robustelli Test, C., Routledge, C.M., Ryan, J.G., Santiago Ramos, D., Shchepetkina, A., Slagle, A.L., Takada, M., Tamborrino, L., Villa, A., Wang, Y., Wee, S.Y., Widlansky, S.J., Yang, K., Kurz, W., Prakasam, M., Tian, L., Yu, T., and Zhang, G., 2024. Site U1559. In Coggon, R.M., Teagle, D.A.H., Sylvan, J.B., Reece, J., Estes, E.R., Williams, T.J., Christeson, G.L., and the Expedition 390/393 Scientists, South Atlantic Transect. Proceedings of the International Ocean Discovery Program, 390/393: College Station, TX (International Ocean Discovery Program). http://doi.org/10.14379/iodp.proc.390393.109.2024
Colantoni, P., Fabbri, A., Gallignani, P., Sartori, R., and Rehault, J.P., 1981. Carta Litologica e Stratigrafica dei Mari Italiani, scala 1/1.500.000. Italy: Litografia Artistica Cartografica.
Comas, M.C., Zahn, R., Klaus, A., et al., 1996. Proceedings of the Ocean Drilling Program, Initial Reports, 161: College Station, TX (Ocean Drilling Program). http://doi.org/10.2973/odp.proc.ir.161.1996
Davis, J.K., and Lavier, L.L., 2017. Influences on the development of volcanic and magma-poor morphologies during passive continental rifting. Geosphere, 13(5):1524–1540. http://doi.org/10.1130/GES01538.1
Della Vedova, B., Bellani, S., Pellis, G., and Squarci, P., 2001. Deep temperatures and surface heat flow distribution. In Vai, G.B. and Martini, I.P., Anatomy of an Orogen: the Apennines and Adjacent Mediterranean Basins. (Springer), 65–76. http://doi.org/10.1007/978-94-015-9829-3_7
Dembicki, H., Jr., 2009. Three common source rock evaluation errors made by geologists during prospect or play appraisals. AAPG Bulletin, 93(3):341–356. http://doi.org/10.1306/10230808076
Di Stefano, A., Baldassini, N., Raffi, I., Fornaciari, E., Incarbona, A., Negri, A., Negri, A., Bonomo, S., Villa, G., Di Stefano, E., and Rio, D., 2023. Neogene-Quaternary Mediterranean calcareous nannofossil biozonation and biochronology: a review. Stratigraphy, 20(4):259–302. http://www.micropress.org/microaccess/check/2342
Ellis, D.V., and Singer, J.M., 2007. Well Logging for Earth Scientists (2nd edition): New York (Elsevier). http://doi.org/10.1007/978-1-4020-4602-5
Fabbri, A., and Curzi, P., 1979. The Messinian of the Tyrrhenian Sea: seismic evidence and dynamic implications. Giornale di Geologia, 43:215–248.
Faganeli, J., Planinc, R., Pezdič, Smodiš, B., Stegnar, P., and Ogorelec, B., 1991. Marine geology of the Gulf of Trieste (northern Adriatic): geochemical aspects. Marine Geology, 99(1):93–108. http://doi.org/10.1016/0025-3227(91)90085-I
Gaullier, V., and Vendeville, B.C., 2005. Salt tectonics driven by sediment progradation: Part II—Radial spreading of sedimentary lobes prograding above salt. AAPG Bulletin, 89(8):1081–1089. http://doi.org/10.1306/03310503064
Goldhaber, M.B., and Kaplan, I.R., 1974. The sulfur cycle. In Goldberg, E.D., The Sea (Volume 5): Marine Chemistry. New York (Wiley), 569–655.
Goldman, J.C., Caron, D.A., and Dennett, M.R., 1987. Regulation of gross growth efficiency and ammonium regeneration in bacteria by substrate C: N ratio. Limnology and Oceanography, 32(6):1239–1252. http://doi.org/10.4319/lo.1987.32.6.1239
Gradstein, F.M., Ogg, J.G., Schmitz, M.D., and Ogg, G.M. (Eds.), 2020. Geologic Time Scale 2020: Amsterdam (Elsevier BV). http://doi.org/10.1016/C2020-1-02369-3
Haese, R.R., Meile, C., Van Cappellen, P., and De Lange, G.J., 2003. Carbon geochemistry of cold seeps: methane fluxes and transformation in sediments from Kazan mud volcano, eastern Mediterranean Sea. Earth and Planetary Science Letters, 212(3):361–375. http://doi.org/10.1016/S0012-821X(03)00226-7
Hopkinson, C.S., Fry, B., and Nolin, A.L., 1997. Stoichiometry of dissolved organic matter dynamics on the continental shelf of the northeastern U.S.A. Continental Shelf Research, 17(5):473–489. http://doi.org/10.1016/S0278-4343(96)00046-5
Jørgensen, B.B., 2000. Pathways of organic matter degradation. In Schulz, H.D., and Zabel, M. (Eds.), Marine Geochemistry (2nd edition). Berlin (Springer-Verlag).
Jørgensen, B.B., Nelson, D.C., Amend, J.P., Edwards, K.J., and Lyons, T.W., 2004. Sulfide oxidation in marine sediments: geochemistry meets microbiology. In Amend, J.P., Edwards, K.J., and Lyons, T.W. (Eds.), Sulfur Biogeochemistry - Past and Present. 379: Special Paper - Geological Society of America. http://doi.org/10.1130/0-8137-2379-5.63
Kastens, K.A., Mascle, J., Auroux, C., et al., 1987. Proceedings of the Ocean Drilling Program, Initial Reports: College Station, TX (Ocean Drilling Program). http://doi.org/10.2973/odp.proc.ir.107.1987
Kastner, M., 1981. Authigenic silicates in deep sea sediments: formation and diagenesis. In Emiliani, C., The oceanic lithosphere. The Sea, 7: New York (Wiley), 915–980.
Kirschvink, J.L., 1980. The least-squares line and plane and the analysis of palaeomagnetic data. Geophysical Journal International, 62(3):699–718. http://doi.org/10.1111/j.1365-246X.1980.tb02601.x
Lirer, F., Foresi, L.M., Iaccarino, S.M., Salvatorini, G., Turco, E., Cosentino, C., Sierro, F.J., and Caruso, A., 2019. Mediterranean Neogene planktonic foraminifer biozonation and biochronology. Earth-Science Reviews, 196:102869. http://doi.org/10.1016/j.earscirev.2019.05.013
Malinverno, A., Zitellini, N., Estes, E.R., Abe, N., Akizawa, N., Bickert, M., Cunningham, E.H., Di Stefano, A., Filina, I.Y., Fu, Q., Gontharet, S., Kearns, L.E., Koorapati, R.K., Lei, C., Loreto, M.F., Magri, L., Menapace, W., Morishita, T., Pandey, A., Pavlovics, V.L., Pezard, P.A., Poulaki, E.M., Rodriguez-Pilco, M.A., Sanfilippo, A., Shuck, B.D., Vannucchi, P., and Zhao, X., 2025. Expedition 402 methods. In Zitellini, N., Malinverno, A., Estes, E.R., and the Expedition 402 Scientists, Tyrrhenian Continent–Ocean Transition. Proceedings of the International Ocean Discovery Program, 402: College Station, TX (International Ocean Discovery Program). http://doi.org/10.14379/iodp.proc.402.102.2025
Martin, J.B., Gieskes, J.M., Torres, M., and Kastner, M., 1993. Bromine and iodine in Peru margin sediments and pore fluids: implications for fluid origins. Geochimica et Cosmochimica Acta, 57(18):4377–4389. http://doi.org/10.1016/0016-7037(93)90489-J
Meyers, P.A., 1994. Preservation of elemental and isotopic source identification of sedimentary organic matter. Chemical Geology, 114(3–4):289–302. http://doi.org/10.1016/0009-2541(94)90059-0
Michard, G., Church, T.M., and Bernat, M., 1974. The pore water chemistry of recent sediments in the western Mediterranean basin. Journal of Geophysical Research (1896-1977), 79(6):817–824. http://doi.org/10.1029/JC079i006p00817
Pérez-Gussinyé, M., Morgan, J.P., Reston, T.J., and Ranero, C.R., 2006. The rift to drift transition at non-volcanic margins: insights from numerical modelling. Earth and Planetary Science Letters, 244(1–2):458–473. http://doi.org/10.1016/j.epsl.2006.01.059
Pimmel, A., and Claypool, G., 2001. Introduction to shipboard organic geochemistry on the JOIDES Resolution. Ocean Drilling Program Technical Note, 30. http://doi.org/10.2973/odp.tn.30.2001
Prada, M., Sallares, V., Ranero, C.R., Vendrell, M.G., Grevemeyer, I., Zitellini, N., and de Franco, R., 2014. Seismic structure of the Central Tyrrhenian basin: Geophysical constraints on the nature of the main crustal domains. Journal of Geophysical Research: Solid Earth, 119(1):52–70. http://doi.org/10.1002/2013JB010527
Prada, M., Sallares, V., Ranero, C.R., Vendrell, M.G., Grevemeyer, I., Zitellini, N., and de Franco, R., 2015. The complex 3-D transition from continental crust to backarc magmatism and exhumed mantle in the Central Tyrrhenian basin. Geophysical Journal International, 203(1):63–78. http://doi.org/10.1093/gji/ggv271
Ranero, C.R., and Sallarès, V., 2017. Seismic Data from MEDOC-2010 cruise [dataset]. Pangaea. http://doi.org/10.1594/PANGAEA.880761
Roether, W., Manca, B.B., Klein, B., Bregant, D., Georgopoulos, D., Beitzel, V., Kovačević, V., and Luchetta, A., 1996. Recent changes in eastern Mediterranean deep waters. Science, 271(5247):333–335. http://doi.org/10.1126/science.271.5247.333
Roveri, M., Lugli, S., Manzi, V., and Schreiber, B.C., 2008. The Messinian Sicilian stratigraphy revisited: new insights for the Messinian salinity crisis. Terra Nova, 20(6):483–488. http://doi.org/10.1111/j.1365-3121.2008.00842.x
Sartori, R., Torelli, L., Zitellini, N., Carrara, G., Magaldi, M., and Mussoni, P., 2004. Crustal features along a W–E Tyrrhenian transect from Sardinia to Campania margins (Central Mediterranean). Tectonophysics, 383(3):171–192. http://doi.org/10.1016/j.tecto.2004.02.008
Sayles, F.L., and Mangelsdorf, P.C., 1977. The equilibration of clay minerals with sea water: exchange reactions. Geochimica et Cosmochimica Acta, 41(7):951–960. http://doi.org/10.1016/0016-7037(77)90154-5
Shipboard Scientific Party, 1978. Site 373: Tyrrhenian Basin. In Hsü, K., Montadert, L., et al., Initial Reports of the Deep Sea Drilling Project. 42(1): Washington, DC (US Government Printing Office), 151–174. http://doi.org/10.2973/dsdp.proc.42-1.104.1978
Shipboard Scientific Party, 1987a. Site 653: Cornaglia Terrace. In Kastens, K.A., Mascle, J, Auroux, C, et al., Proceedings of the Ocean Drilling Program, Initial Reports. 107: College Station, TX (Ocean Drilling Program), 599–745. http://doi.org/10.2973/odp.proc.ir.107.109.1987
Shipboard Scientific Party, 1987b. Site 654: upper Sardinian margin. In Kastens, K.A., Mascle, J, Auroux, C, et al., Proceedings of the Ocean Drilling Program, Initial Reports. 107: College Station, TX (Ocean Drilling Program), 747–875. http://doi.org/10.2973/odp.proc.ir.107.110.1987
Sylvan, J.B., Estes, E.R., Bogus, K., Colwell, F.S., Orcutt, B.N., and Smith, D.C, 2021. Technical Note 4: Recommendations for microbiological sampling and contamination tracer use aboard the JOIDES Resolution following 20 years of IODP deep biosphere research. International Ocean Discovery Program Technical Note. http://doi.org/10.14379/iodp.tn.4.2021
Tanhua, T., Hainbucher, D., Schroeder, K., Cardin, V., Álvarez, M., and Civitarese, G., 2013. The Mediterranean Sea system: a review and an introduction to the special issue. Ocean Science, 9(5):789–803. http://doi.org/10.5194/os-9-789-2013
The Shipboard Scientific Party, 1973a. Boundary of Sardinia slope with Balearic abyssal plain: Sites 133 and 134. In Ryan, W.B.F., Hsü, K.J., et al., Initial Reports of the Deep Sea Drilling Project. 13: Washington, DC (US Government Printing Office), 465–514. http://doi.org/10.2973/dsdp.proc.13.114.1973
The Shipboard Scientific Party, 1973b. Tyrrhenian Rise: Site 132. In Ryan, W.B.F., Hsü, K.J., et al., Initial Reports of the Deep Sea Drilling Project. 13: Washington, DC (US Government Printing Office), 403–464. http://doi.org/10.2973/dsdp.proc.13.113.1973
Tissot, B.P., and Welte, D.H., 1984. Petroleum Formation and Occurrence (2nd edition): Berlin Heidelberg GmbH (Springer-Verlag). http://www.osti.gov/biblio/6632464
Tsimplis, M.N., and Baker, T.F., 2000. Sea level drop in the Mediterranean Sea: an indicator of deep water salinity and temperature changes? Geophysical Research Letters, 27(12):1731–1734. http://doi.org/10.1029/1999GL007004
Werne, J.P., Haese, R.R., Zitter, T., Aloisi, G., Bouloubassi, I., Heijs, S., Fiala-Médioni, A., Pancost, R.D., Sinninghe Damsté, J.S., de Lange, G., Forney, L.J., Gottschal, J.C., Foucher, J.-P., Mascle, J., and Woodside, J., 2004. Life at cold seeps: a synthesis of biogeochemical and ecological data from Kazan mud volcano, eastern Mediterranean Sea. Chemical Geology, 205(3):367–390. http://doi.org/10.1016/j.chemgeo.2003.12.031
Zherebtsova, I.K., and Volkova, N.N., 1966. Experimental study of behavior of trace elements in the process of natural solar evaporation of Black Sea water and Sasyk-Sivash brine. Geochemistry International, 3:656–670.